Summary
Students learn how seasonal flooding from snowmelt affects rivers and evaluate how changing environmental conditions, such as flood levels and temperatures, influence the distribution and abundance of organisms such as mosquitoes. In this hands-on activity, students build a river model using stream tables to explore the factors that affect water flow and velocity. Using what they learn, students predict how flooding impacts mosquito populations. Finally, they develop a vector control strategy to reduce mosquito populations and help prevent the spread of mosquito-borne diseases.Engineering Connection
Environmental engineers work to understand how water flow, weather patterns, and climate change influence natural events such as flooding. By building a river model and analyzing water flow, students are mimicking the work of environmental engineers, who design solutions to manage water systems, prevent flooding, and protect habitats. Additionally, developing a vector control strategy to reduce mosquito populations ties into public health, a key area of environmental engineering, as these engineers create systems to prevent the spread of diseases and improve environmental conditions for human and ecological health.
Learning Objectives
After this activity students will be able to:
- Evaluate the activity claim using evidence that changing environmental conditions can impact the relative abundance and distribution of organisms.
- Explain the factors that impact river flow.
- Identify vector control strategies and identify trends in mosquito-borne illnesses.
- Use a model to predict areas prone to flooding.
Educational Standards
Each TeachEngineering lesson or activity is correlated to one or more K-12 science,
technology, engineering or math (STEM) educational standards.
All 100,000+ K-12 STEM standards covered in TeachEngineering are collected, maintained and packaged by the Achievement Standards Network (ASN),
a project of D2L (www.achievementstandards.org).
In the ASN, standards are hierarchically structured: first by source; e.g., by state; within source by type; e.g., science or mathematics;
within type by subtype, then by grade, etc.
Each TeachEngineering lesson or activity is correlated to one or more K-12 science, technology, engineering or math (STEM) educational standards.
All 100,000+ K-12 STEM standards covered in TeachEngineering are collected, maintained and packaged by the Achievement Standards Network (ASN), a project of D2L (www.achievementstandards.org).
In the ASN, standards are hierarchically structured: first by source; e.g., by state; within source by type; e.g., science or mathematics; within type by subtype, then by grade, etc.
NGSS: Next Generation Science Standards - Science
| NGSS Performance Expectation | ||
|---|---|---|
|
HS-ETS1-2. Design a solution to a complex real-world problem by breaking it down into smaller, more manageable problems that can be solved through engineering. (Grades 9 - 12) Do you agree with this alignment? |
||
| Click to view other curriculum aligned to this Performance Expectation | ||
| This activity focuses on the following Three Dimensional Learning aspects of NGSS: | ||
| Science & Engineering Practices | Disciplinary Core Ideas | Crosscutting Concepts |
| Design a solution to a complex real-world problem, based on scientific knowledge, student-generated sources of evidence, prioritized criteria, and tradeoff considerations. Alignment agreement: | Criteria may need to be broken down into simpler ones that can be approached systematically, and decisions about the priority of certain criteria over others (trade-offs) may be needed. Alignment agreement: | |
| NGSS Performance Expectation | ||
|---|---|---|
|
HS-LS2-6. Evaluate the claims, evidence, and reasoning that the complex interactions in ecosystems maintain relatively consistent numbers and types of organisms in stable conditions, but changing conditions may result in a new ecosystem. (Grades 9 - 12) Do you agree with this alignment? |
||
| Click to view other curriculum aligned to this Performance Expectation | ||
| This activity focuses on the following Three Dimensional Learning aspects of NGSS: | ||
| Science & Engineering Practices | Disciplinary Core Ideas | Crosscutting Concepts |
| Evaluate the claims, evidence, and reasoning behind currently accepted explanations or solutions to determine the merits of arguments. Alignment agreement: Scientific argumentation is a mode of logical discourse used to clarify the strength of relationships between ideas and evidence that may result in revision of an explanation.Alignment agreement: | A complex set of interactions within an ecosystem can keep its numbers and types of organisms relatively constant over long periods of time under stable conditions. If a modest biological or physical disturbance to an ecosystem occurs, it may return to its more or less original status (i.e., the ecosystem is resilient), as opposed to becoming a very different ecosystem. Extreme fluctuations in conditions or the size of any population, however, can challenge the functioning of ecosystems in terms of resources and habitat availability. Alignment agreement: Humans depend on the living world for the resources and other benefits provided by biodiversity. But human activity is also having adverse impacts on biodiversity through overpopulation, overexploitation, habitat destruction, pollution, introduction of invasive species, and climate change. Thus sustaining biodiversity so that ecosystem functioning and productivity are maintained is essential to supporting and enhancing life on Earth. Sustaining biodiversity also aids humanity by preserving landscapes of recreational or inspirational value.Alignment agreement: | Much of science deals with constructing explanations of how things change and how they remain stable. Alignment agreement: |
Materials List
Each student needs:
- 1 National Geographic Article
- 1 River Maps Worksheet
- 1 Infographic Directions and Rubric
- 1 Infographic Trends Sheet
- 1 Vector Control Questions
- 1 Stream Table River Modeling Activity Sheet (or Modified Version if no Internet access)
- 1 Claim Evidence Reasoning Worksheet
Each group needs:
- 1 stopwatch or cell phone timer
- 1 camera
- 1 ruler
- aquarium sand
- stream table
- water
- pencil
- 1 funnel
- extra tubing
- duct tape or zip tie
- 2 500 mL beakers
- (optional) laptop, iPad with Internet access
- (optional) pitch locator
Worksheets and Attachments
Visit [www.teachengineering.org/activities/view/nds-2866-environment-solutions-river-dynamics-mosquito-activity] to print or download.Pre-Req Knowledge
Students should have an understanding of the concepts of velocity, erosion, and deposition.
Introduction/Motivation
Today we are going to investigate the impact of flooding on ecosystems.
How will climate change impact ecosystems? (Answer: As ice and snow melt, floods become more frequent in response. Floods will become more and more common as global temperatures continue to rise because of human activity. Not only will these floods impact infrastructure, but they will also impact wildlife populations. After periods of flooding, terrestrial organisms can drown and die, and aquatic organisms can become displaced. River erosion will increase, which will impact organisms in those habitats as well.) (National Geographic: https://education.nationalgeographic.org/resource/many-effects-flooding)
This flooding coincides with an increase in temperatures during spring. This combination of conditions is ideal for mosquitoes to breed in. By studying the characteristics of a watershed, specifically elevation, we can design models that will predict the flow of floodwaters and identify areas that could provide favorable breeding conditions.
Mosquitoes are not only annoying, but they can also spread deadly diseases such as West Nile virus, Zika virus, malaria, St. Louis encephalitis virus, and others. After periods of flooding, mosquito populations will typically rise in response. Scientists can observe this directly, by placing traps to count the number of adult or larval mosquitoes. As a result of increasing population, these diseases will spread more rapidly and become more common in human populations. If scientists can predict areas where flooding will occur, more resources can be allocated for vector control to prevent mosquito populations from increasing.
Why might trapping be a poor method for data collection in some areas? (Answer: In some locations, physical geography could make data collection using this method difficult. For example, in very rough terrain, or large rural areas, it might not be feasible to collect data in a timely manner.)
Procedure
Background
In this activity, students will investigate the impact of flooding on an ecosystem. Specifically, this activity looks at a changing environment and its effect on mosquito populations. Mosquitoes require slow or stagnant waters to lay their eggs, and as areas become flooded, it creates an ideal environment for mosquito reproduction. As floods become more common due to climate change, we could expect to see a rise in mosquito populations. Students will utilize stream tables to develop a three-dimensional model of a river and simulate flooding. Finally, students will utilize their model to predict where mosquitoes will lay their eggs and identify where to allocate vector control resources.
Before the Activity
Before Part 1
- Turn on projector.
- Access the Ucayali River video.
- Access the Hydrology PowerPoint Presentation.
Before Part 2
- Print copies or post pdf of the National Geographic Article - The Many Effects of Flooding. (1 per student)
- Print copies of the Infographic Directions and Infographic Rubric. (1 per student)
Before Part 3
- Print copies of the Infographic Trends Worksheet and the Vector Control Questions. (1 per student for each)
Before Part 4
- Prepare the stream tables with sand and hook up to water source.
- Lay out group materials for the Stream Table River Modeling Activity.
- Print copies of the Stream Table River Modeling Activity Worksheet and Claim-Evidence-Reasoning Worksheet. (1 per student for each)
With the Students
Part 1: Activity Introduction (45 minutes)
- Divide the class into groups of 3-5 students.
- In their groups, give students 5 minutes to discuss the following questions:
- What conditions are needed for mosquitoes to breed? (Answer: Mosquitos breed in shallow water that is stagnant or slow moving. Sites that lack aquatic predators are especially good breeding locations.)
- What factors could increase or decrease the population of mosquitoes? (Answer: If the environment has less moisture, we would expect there to be fewer mosquitoes. Male mosquitoes consume vegetation/flower nectar to survive, whereas female mosquitoes consume the blood of animals. If an ecosystem is lacking in either of those resources, this would negatively impact the mosquito population.)
- As the students brainstorm answers to these questions, project this word cloud generator website for the class to see: https://www.mentimeter.com.
- As a class, generate a word cloud for the first question by having each group enter their answers into the website.
- Generate a word cloud for the second question.
- Have each group enter their answers into the word cloud generator for each question.
- Show students the 43-second video of the Ucayali River from 1985 to 2013. You may want to play it multiple times.
- Give students a few minutes to generate their own questions and/or thoughts about what is happening.
- After the video is over, give students 1-2 minutes to discuss with their groups each of the following questions before asking groups to share their thoughts with the rest of the class:
- What happened to the river over time? (Answer: The river changed course).
- Why do you believe this occurred? (Answer: Rivers meander due to differing rates of erosion and deposition. This often happens in rivers with a lower flow rate, such as those that experience only small changes in elevation.)
- How will this impact organisms in this ecosystem, either positively or negatively? (Answer: Fish may become displaced by river changes, and some organisms will be permanently separated from the rest with the development of an oxbow lake.)
- Take 10 minutes to go through the Hydrology Presentation with the students. Present the information on the slides and ask the questions within the PowerPoint for class discussion. (Note: Sample answers to questions are included within the PowerPoint notes section).
- Give each student a copy of the River Maps Worksheet.
- Have students identify similarities and differences between the Red River and the Ucayali River using the River Maps Worksheet.
Part 2: Research and Infographic (45 minutes)
- Provide students with the National Geographic Article - The Many Effects of Flooding in a pdf or paper format. (Note: You can differentiate the article’s reading level as necessary for students who do not read at their grade level; just select the appropriate reading level at the top of the page of the article.)
- Have each student read the article on their own.
- Have each student make at least five annotations about the article.
- After everyone has finished reading and annotating the article, ask students to think about other ways floods can impact ecosystems, aside from those mentioned in the article.
- Have students share their ideas, and mention to them that even something as small as mosquitoes can be impacted by flooding.
- Divide students into groups of 3-5 students.
- Assign each group a different mosquito-borne illness from the following list: Zika virus, Malaria, Dengue, West Nile virus, Yellow Fever, Chikungunya, Japanese Encephalitis virus, Eastern equine encephalitis, or any other mosquito-borne illness you would like to add.
- Give students time to research their assigned illness.
- Inform students that each group will be creating an infographic on their mosquito-borne illness, which will be presented during a gallery walk in the next class period.
- Provide each group with a copy of the Infographic Directions and Rubric and allow them time to create an infographic, which will need to be ready by the start of the next class period for the gallery walk.
Part 3 (45 minutes)
- Begin the class by having each group have their infographic on display.
- Explain to students that each group will do a gallery walk around the room, reading the information on each infographic and looking for trends they notice about the information on mosquito-borne illnesses. Each student will need an Infographic Trends Sheet and will answer the questions with their group members for approximately 15 minutes.
- Once students have completed the Infographic Trends Sheet, ask groups to share their findings with the class about trends they noticed. Compile a list of trends on the whiteboard.
- Ask the groups to discuss the following questions:
- “How could you measure mosquito populations?” Things students should consider before answering this question: “How much labor is realistic, and how many people would be needed to collect data? How much time and money is reasonable for this task? What technology or equipment would be required for collecting data?”
- Have groups share their ideas once they’ve had time to discuss.
- Ask students: “Once data is gathered, how will it be analyzed?” The goal of this is to generate student ideas. Students will be investigating vector control methods in the next activity.
- Hand out the Vector Control Questions.
- Have students investigate vector control methods as described in the directions.
Part 4 (45 minutes)
- Hand out the Stream Table River Modeling Activity Worksheet to each student and briefly go over the instructions for the pre-lab and activity.
- Have students use their phones, iPads, or computers to access Google Earth and begin answering the pre-lab questions (Note: If students do not have devices that access the internet, you can use the Modified Stream Table River Modeling Activity Worksheet.)
- Once students are finished with the pre-lab questions, have them begin Procedures 1 and 2.
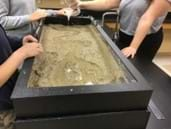
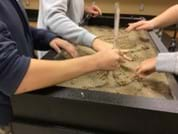
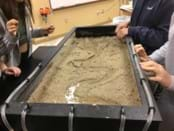
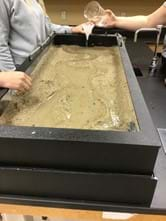
- Have students answer the discussion questions. (Images 1-3 show the progression of Procedure 1, and Images 4-5 show the progression of Procedure 2).
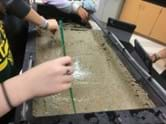
Before creating your riverbed smooth the sand and do your best to maintain a consistent depth. This is the first step in procedure 1.

- Have students clean up their work area.
- Have students work on the post-activity assessment: Claim Evidence Reasoning Worksheet.
Vocabulary/Definitions
deposition: The laying down of sediment carried by wind, flowing water, the sea, or ice. (from bgs.ac.uk)
discharge: The volume of water flowing through a river channel. (from climate.copernicus.eu)
ecosystem: A system, or a group of interconnected elements, formed by the interaction of a community of organisms with their environment:
elevation: The altitude of a place above sea level or ground level.
erosion: The process by which the surface of the earth is worn away by the action of water, glaciers, winds, waves, etc.
larva: The immature, wingless, feeding stage of an insect.
mitigation: The act of making a condition or consequence less severe.
oxbow lake: A curved lake created by a meandering river changing paths.
vector: An insect or other organism that transmits a pathogenic fungus, virus, bacterium, etc.
Assessment
Pre-Activity Assessment
Brainstorm: Have students brainstorm answers to the following questions for approximately 10 minutes.
- What conditions are needed for mosquitoes to thrive?
- What factors could increase or decrease the populations of mosquitoes?
Remind students that their goal is to generate as many ideas as possible. Encourage students to demonstrate respect for all ideas by carefully considering input from all group members. As a class, generate a word cloud to determine the factors most mentioned.
Activity Embedded (Formative) Assessment
Infographic: Student groups create an infographic on a specific mosquito-borne illness, using sources from at least two organizations. The teacher assesses each group infographic using the Infographic Directions and Rubric.
Infographic Trends: After viewing infographics on different mosquito-borne illnesses, students complete the Infographic Trends Sheet to identify trends or commonalities.
Vector Control: After carefully reading the information on a given web page, students answer questions in the Vector Control Worksheet to show their comprehension of the material.
Post-Activity (Summative) Assessment
Claim Evidence Reasoning: Students complete the Claim Evidence Reasoning Worksheet to answer the question: What is the relationship between flooding and the abundance of mosquito breeding habitats? After making the claim, they reference images they have captured during the activity to support their claim and then use the following terms to support their reasoning: discharge, oxbow lake, ecosystem, mosquito larva.
Troubleshooting Tips
It is helpful if you can find fine-grain sand, as that will experience erosion and deposition even at very low flow rates. Aquarium sand is good for this purpose.
Subscribe
Get the inside scoop on all things TeachEngineering such as new site features, curriculum updates, video releases, and more by signing up for our newsletter!More Curriculum Like This

Students learn about floods, discovering that different types of floods occur from different water sources, but primarily from heavy rainfall. Students learn what makes floods dangerous and what engineers design to predict, control and survive floods.
References
Cass County Vector Control - https://www.casscountynd.gov/our-county/vector-control
Center for Disease Control – https://www.cdc.gov/mosquitoes/mosquito-control/community/mosquitoes-and-hurricanes.html
Metro Flood Diversion Authority - https://fmdiversion.gov/about/faqs
National Geographic - https://education.nationalgeographic.org/resource/many-effects-flooding
U. S. Bureau of Labor and Statistics - https://www.bls.gov/ooh/life-physical-and-social-science/hydrologists.htm#:~:text=in%20the%20field.-,Hydrologists%20study%20how%20water%20moves%20across%20and%20through%20the%20Earth's,or%20eventually%20reach%20the%20oceans
U. S. Geologic Survey - https://waterdata.usgs.gov/monitoring-location/05054000
Copyright
© 2024 by Regents of the University of Colorado; original © 2024 North Dakota State UniversityContributors
Matt Stone (West Fargo Public Schools), Sarah Crary (North Dakota State University), Beena Ajmera (Iowa State University)Supporting Program
Research Experience for Teachers (RET) Site at North Dakota State UniversityAcknowledgements
This curriculum was developed through the Research Experience for Teachers (RET) Site at NDSU under grant number 2224135 under the National Science Foundation. However, these contents do not necessarily represent the policies of the NSF, and you should not assume endorsement by the federal government.
Special thanks to Jared Lamirante and Ben Prather of Cass County Vector Control for working with us on providing mosquito count data.
Last modified: October 31, 2024


User Comments & Tips