Lesson GIS, Mathematics and Engineering Integration

Quick Look

Grade Level: 7 (6-8)

Time Required: 1 hour

Lesson Dependency: None

This lesson requires the resource(s):

A graphic in map form shows the amount of energy the U.S. receives from the sun on average. Higher amounts of energy are displayed in red and generally include the south and west while lower energy areas are displayed in yellows and greens and tend to be in the north and east. The image was formed using GIS technology.
A map created with GIS technology shows the amount of energy that different parts on the U.S. receive from the sun. Engineers create and use maps like this to identify the best locations to place solar cell arrays for electricity generation.
copyright
Copyright © 2008 National Renewable Energy Laboratory, U.S. Department of Energy, public domain https://www.eia.gov/energyexplained/index.php?page=solar_where

Summary

The concept of geocaching is introduced as a way for students to explore using a global positioning system (GPS) device and basic geographic information (GIS) skills. Students familiarize themselves with GPS, GIS, and geocaching as well as the concepts of latitude and longitude. They develop the skills and concepts needed to complete the associated activity while considering how these technologies relate to engineering. Students discuss images associated with GPS, watch a video on how GPS is used, and review a slide show of GIS basics. They estimate their location using latitude and longitude on a world map and watch a video that introduces the geocaching phenomenon. Finally, students practice using a GPS device to gain an understanding of the technology and how location and direction features work while sending and receiving data to a GIS such as Google Earth.

Engineering Connection

Civil, petroleum and environmental engineers, and many others, use GPS and GIS to analyze data and make informed decisions. Some civil engineers use GPS and GIS in large-scale urban planning projects. Some petroleum engineers map the extent of rock outcroppings known to contain oil or gas deposits by using GPS devices to map the outcropping surface and using GIS to integrate other data into the map. Environmental engineers may use these tools to map water resources and study climate change. This lesson demonstrates another important connection between engineering and math—problem solving—as students break up larger composite shapes into smaller shapes in order to simplify their calculations.

Learning Objectives

After this lesson, and its associated activity, students should be able to:

  • Determine a latitude and longitude from a map.
  • Operate a GPS device.
  • Identify location by its latitude and longitude.
  • Create a waypoint.
  • Use compass and distance features.

Worksheets and Attachments

Visit [www.teachengineering.org/curriculum/print/uow-2262-integrating-gis-mathematics-engineering-gps] to print or download.

Pre-Req Knowledge

Familiarity with calculating the area of regular and irregular shapes, finding missing angle measurements, and complementary and supplementary angles.

Introduction/Motivation

At any given moment, thousands of satellites orbit the Earth. In fact, on any clear, cloudless night away from city lights, you may be able to look up and spot a satellite or two passing overhead! 

The satellites are used for many purposes: military, data collection, communication, weather. One famous satellite is the Hubble Space Telescope—a vital research tool that does not look at the Earth, but instead scans the darkness of space to study our universe. One of the most important satellites is a group of satellites that compose a navigation system called the global positioning system, commonly known as GPS. This satellite-based system—developed by the U.S. government for military use in the 1970s, and later for civilian use in the 1980s—provides information about position and location to users around the globe, including you!

A colorful artist's rendition shows a GPS satellite in orbit. The satellite is adorned with solar panels for generating electricity and has a metallic core with various instruments surrounding the main body.
An artist’s rendering of a GPS satellite in orbit.
copyright
Copyright © 2012 U.S. Government, Wikimedia Commons (public domain) https://commons.wikimedia.org/wiki/File:GPS-IIRM.jpg

We can use GPS through GPS-enabled devices, such as car navigation systems and smartphone apps. Most commonly, apps like Google Maps or Apple Maps use GPS to help everyday users with driving directions or location finding. However, GPS has a wide range of commercial and business applications, particularly in engineering. Civil engineers use GPS to survey and plan community infrastructure projects. Aerospace engineers incorporate GPS in aircraft and rocket design to assist with navigation. Environmental engineers employ GPS to gather data on geographic locations and the wildlife contained within them.

Before we dive deeper into other applications of GPS, let’s take a look at the following questions and see if we can answer them.

What is GPS? What does it do?

  • GPS stands for global positioning system.
  • It helps you pinpoint your location, usually on a map.

What would you used GPS for?

  • GPS is used via a GPS-enabled device and a software application interface to obtain driving directions, plot a course, or find a location or waypoint on a map.

Why would engineers put GPS capability on a rocket? (Show students the rocket image below.)

  • To make sure it doesn’t land somewhere dangerous and arrives at its intended destination.

A photograph shows a blasting off rocket (equipped with a GPS satellite) as it propels through the air, trailing a stream of flame and smoke from the engines. The rocket is red on top and white on bottom with a red stripe in the middle. Overlaid text reads “IN POSITION. Air Force launches newest GPS satellite.”
A rocket launched into space with a GPS satellite in its payload.
copyright
Copyright © 2012 Robin Meredith, U.S. Air Force, 45th Space Wing Public Affairs (public domain) http://www.af.mil/News/Article-Display/Article/110340/air-force-launches-new-gps-satellite/

What kind(s) of engineers are needed to design and launch rockets?

  • So many types! For example, aerospace, mechanical, materials, chemical, computer and software engineers.

Why do you think people/engineers might want to monitor the location of animals, such as wolves? (Show the wolf image below.)

  • To monitor their migration habits, check on the health of animals released after medical treatment, and track endangered species.

A photograph shows a gray wolf (canis lupus) facing the camera and wearing a tracking collar. The wolf is on snowy ground with branches in the foreground and background. His coat is mostly gray, white and black, with a patch of red near his shoulder.
A gray wolf in the wild wearing a tracking collar.
copyright
Copyright © 2003 U.S. Fish and Wildlife Service, Wikimedia Commons (public domain) https://commons.wikimedia.org/wiki/File:Canis_lupus_with_radio_collar.jpg

Why might engineers need to know locations on earth? How about locations in space?

  • To study a given area and help humans utilize the resources
  • To collect data
  • To help improve the world
  • To navigate effectively and to avoid other space objects

(As either an introduction or lesson supplement, consider showing students one of the following TEDx Talk videos: Geographic Information Systems (GIS): Dan Scollon at TEDxRedding; from sciBRIGHT, How Does GPS Work?; or from Esri, What is GIS? Also, introduce students to the PDF titled The Fundamentals of GIS and Real-World Applications Handout and go over it throughout the lesson.)

Introducing GIS

If any of you have used a navigation app such as Google Maps, then you have used a GIS—even if you were not aware of it!

To understand GIS and GPS, we must first understand how we mark locations on the earth. People use a GPS-enabled device to identify their locations using latitude and longitude. Latitude and longitude are like the x- and y-axes on the coordinate plane. To picture this, imagine unrolling the earth's surfaace and making it flat, like a paper map. Then, overlay a grid of axes over the map (as in Figure 1). The lines that identify your location from north to south we call lattitude. The lines that represent your location from east to west we call longitude. The equator—a horizontal line that passes through South America, sub-Saharan Africa, and much of Indonesia—represents the x-axis: 0° north and south, while the prime meridian—a vertical line passing through the UK—represents the y-axis: 0° east and west.

An ovular map of the world with a light brown color showing the land masses and blue for the oceans. Only continents and oceans are labeled. Parallel straight lines go east to west and curved lines run north and south, each labeled with an angle measure.
Figure 1. This world map shows lines of latitude and longitude, including red segments denoting the prime meridian (longitude 0°), equator (latitude 0°), Arctic Circle, Antarctic Circle, Tropic of Cancer, and Tropic of Capricorn.
copyright
Copyright © 2008 Dbachmann, OpenGL, Wikimedia Commons https://commons.wikimedia.org/wiki/File:Earthmap720x360_grid.jpg

One example using latitude and longitude is to determine the approximate center of the lower 48 U.S. states, located at (latitude) 39.8° north and (longitude) 98.6° west near Lebanon, KS.

Now, estimate the location of your school using this latitude and longitude map. During the next part of the lesson, we will check our estimates with real GPS coordinates. You can also estimate coordinates on a physical map in the classroom, such as one from National Geographic. Just remember, for latitude, include the degree symbol ° and “north” or “south.” For longitude, include the degree symbol ° and “east” or “west.”

Geocaching

A photograph shows a rectangular green label with black lettering and the official geocache URL (geocaching.com) and logo/emblem—a cartoon of a person tracking towards a waypoint flag, searching for a hidden treasure. Blank lines prompt the user to fill in the cache name, contact name, and contact info.
An example official geocache label that users affix to a hidden container.
copyright
Copyright © 2012 Lee Cannon, Flickr, CC BY-SA 2.0 https://www.flickr.com/photos/leecannon/6924688841 This image has not been modified in any way from its original form.

One fascinating and fun use of GPS and GIS technologies is a hobby called “geocaching.” This is a treasure-hunting activity that takes place worldwide and is open to everyone who has a sense of adventure and a GPS device or smartphone! Let's watch this short video, “What is Geocaching,” to learn more about this real-world adventuring that is happening right now all around you.

We are going to work with geocaches using our own GPS devices during a future activity, all while exploring what it would be like to be an engineer using GIS and GPS!

GPS Hardware and GIS Software

In preparation for the activity, we will practice:

  • Creating and sending a waypoint to Google Earth
  • Determining your distance from a waypoint
  • Navigating to and from the waypoint
  • Following a compass bearing

Below are screen captures from the Apple iOS software. For the purposes of this tutorial, the following instructions are for the “Free GPS” app, available on the iOS platform. Alternate GPS apps are available for Android operating systems, such as “Maverick: GPS Navigation” and “Handy GPS.” Google Earth is available for both iOS and Android from the App Store and Google Play. You can also use a desktop version of Google Earth to export or email waypoint data from a smartphone.

Example—How to Create and Send Waypoints to Google Earth:

The main screen in the Free GPS app shows your compass bearing and the distance from a chosen waypoint (as shown in Figure 2).

A screen capture image shows an iPad running the Free GPS app. It shows the user’s heading, speed, and distance from the selected waypoint. It also shows three buttons for input: Settings, Map, and Waypoints.
Figure 2. The home screen for the Free GPS app.
copyright
Copyright © 2018 Jake Schell, University of Wyoming

Open the Free GPS app. To create a waypoint, simply click on “Waypoints” and then “Add Waypoint.” If you are in the location you want to use, click on “Add Current Position” to use your current position for the new waypoint. This will enable you to see the latitude and longitude of your location, and change the name of the waypoint. See Figure 3.

This image is a screenshot of an iPad running the app Free GPS. It shows the waypoint’s latitude and longitude, name, and has three buttons for user input. They are “Help,” “Cancel,” and “Add”.
Figure 3. The waypoint screen for the Free GPS app.
copyright
Copyright © 2018 Jake Schell, University of Wyoming

Take note of your location in latitude and longitude of the classroom as an example. Again, for latitude remember to include the degree symbol ° and “north” or “south.” For longitude, include the degree symbol ° and “east” or “west.”   

To send a waypoint from this app to Google Earth, simply go to “Settings” and click “Email Waypoints." See Figure 4.

This image is a screenshot of an iPad running the app Free GPS. It shows the settings screen, which allows users to adjust units for latitude and longitude and distance, as well as contact the application’s developer and send files to email addresses.
Figure 4. The settings screen for the Free GPS app.
copyright
Copyright © 2018 Jake Schell, University of Wyoming

Open Google Earth on a computer. Then open the file from the email on your computer and notice how it appears in Google Earth.

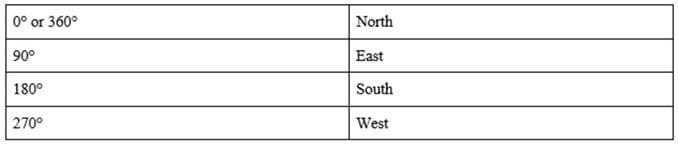
Next, we will walk around the room to experience how the distance and compass functions work. On the main screen, the app shows how far you have walked from the waypoint you created originally. You will use a feature like this in the activity. Be sure you hold the device flat, parallel to the ground. Notice as you move, so does the compass, showing your heading facing straight in front of the device. You will also need to use this compass bearing during the activity. Here is a helpful chart to familiarize yourself with compass headings and how they relate to north, south, east, and west (sketch this table on the classroom board).

(Once students are familiar with the app, move on to conduct the Geometry and Geocaching Using GIS and GPS activitiy.)

Lesson Background and Concepts for Teachers

Geographic information systems (GIS) integrate data from a wide variety of fields—natural sciences, social sciences, and engineering—and display data in map form. The global positioning system (GPS) is a global satellite-based navigation array that provides location and time information to GPS receivers anywhere on or near the Earth, provided the device has a line of sight to four or more GPS satellites. GIS and GPS go hand-in-hand as much of the data used in GIS is obtained with GPS coordinates to pinpoint locations based on data.

Geocaching is a hobby in which people hide items around the world and post instructions on how to find them. Then, other geocache hunters use GPS-enabled devices to find the hidden cache, or treasure. GPS devices display a user’s location on a map from which they can save their locations and upload the data to a computer. Many devices have GPS receivers embedded within them, such as smartphones as well as technology used in engineering like surveying equipment. Students take the role of a geocache hunter, using a GPS-enabled device to locate a certain point on the Earth’s surface. They use hints at each waypoint to find other locations. When mapped out on Google Earth, they can visualize the length and direction of where they traveled. Refer to the Topographic Maps and Ratios: A Study of Denali activity for students to discover how to use map scales as ratios to navigate a map. 

Engineers of all types use GPS and GIS to acquire, compile, and view data so they may make informed decisions throughout their problem-solving process. This lesson introduces students to GIS and GPS through the lens of geocaching while practicing other concepts like geometry and scale. Students need to be familiar with calculating area of regular and irregular shapes, finding missing angle measures, and understanding complementary and supplementary angles. The lesson is also suitable for use in conjunction with rate and unit rate concepts.

Most free GPS apps are quite user friendly and can be used by individuals with limited knowledge of GPS and GIS. This lesson uses one example of a free GPS app available for iOS. If you decide to use another application (for example, on an Android device), you must know how to send waypoints to Google Earth via email in the form of KML files (also known as keyhole markup language—a computer text language that expresses geographic annotation and visualization). If the KML file does not load in Google Earth, click and directly drag the file into Google Earth from its folder wherever you chose to save it. To do this, release the mouse pointer over the map portion of Google Earth.

Most GPS software provides a way for users to send waypoints to Google Earth as KML files. Make sure the teachers and students understand the GPS software of the devices used in the classroom.

Before undertaking this lesson and its associated activities, it is recommended that the teacher become familiar with the technologies—both GPS and GIS (Google Earth). For more information on teacher preparation, refer to the Geometry and Geocaching Using GIS and GPS activity.

Lesson Closure

What is GIS? What is GPS? How are they related? How does geocaching use these technologies? Why might different types of engineers want to use GIS and GPS in their jobs? When do you use GIS in your daily activities? What are latitude and longitude?

Vocabulary/Definitions

coordinate: The combination of longitude and latitude, along with elevation, make a GPS coordinate which defines a single point on the surface of the earth.

geographic information system: A way to store, edit, and manipulate data or information, usually using maps; commonly referred to as GIS.

global positioning system: A satellite based navigation system that allows users to determine their position on the earth, among other uses; commonly referred to as GPS. More broadly, GPS can refer to any device used to locate a given position.

latitude: This represents an angle north or south of the equator, but is more easily understood as the y-coordinate of a location on the surface of the earth.

longitude: This represents an angle east or west of the prime meridian, but is more easily understood as the x-coordinate of a location on the surface of the earth.

waypoint: In the case of navigation, a fixed longitudinal and latitudinal coordinate or GPS point that identify a physical point.

Assessment

Pre-Lesson Assessment

Turn and Talk: Conduct a class discussion prompted by the following questions. Students' answers and comments reveal their base understanding of the lesson topic.

  • What is GPS?
  • What is GIS?
  • Have you ever used either?
  • Can you think of any type of engineer who might use either?

Post-Introduction Assessment

Re-Visit Turn and Talk: Ask the same discussion questions again after presenting and completing the Introduction/Motivation section as a way to gauge how much information students learned.

Lesson Summary Assessment

Researching Engineers: Based on their knowledge of GPS, GIS, and geocaching, discuss as a class the types of engineers that may use these geographic information tools. Prompt students with the following career paths:

  • Civil engineer
  • Mechanical engineer
  • Energy systems engineer
  • Biomedical engineer
  • Geologic engineer
  • Another engineer type of your choice (check with teacher first)

Homework

Activity Prep: Have students prepare for the associated activity by either downloading a free GPS app and creating at least three waypoints on their way home from school (if they have access to their own smartphones). Or, create an assignment using The Fundamentals of GIS and Real-World Applications Handout such as exploring Google Earth or finding a particular set of latitudes and longitudes on a traditional 2D/paper map. 

Lesson Extension Activities

Give students time to research different types of engineers. Either assign students to individually research and write about these career types, or present their findings in small groups.

Subscribe

Get the inside scoop on all things TeachEngineering such as new site features, curriculum updates, video releases, and more by signing up for our newsletter!
PS: We do not share personal information or emails with anyone.

References

Katrina Patton. The Fundamentals of GIS and Real World Application (PDF). University of Western Wyoming. https://www.teachengineering.org/content/uow_/lessons/uow-2262-integrating-GIS/uow-2262-integrating-GIS-fundamentals-of-GIS-handout.pdf

Using Your iPhone & Google Earth for Plot Mapping (PDF). University of California Davis. http://wrir4.ucdavis.edu/Resources/Tricks/docs/GPS-GoogleEarth%20Plot%20Mapping-iPhone.pdf

Other Related Information

Find additional interesting lessons about GIS in TeachEngineering by searching with "GIS" as a keyword. Most of these lessons and their associated activities involve data, maps, and projections, and are great activities to conduct in association with this lesson (see list below). However, this lesson and activity deals with a different niche that is not available in other lessons: the hands-on use of a GPS device and its integration with GIS is unique.

Other relevant lessons and activities at TeachEngineering.org:

What Is GIS?

Projections and Coordinates: Turning a 3D Earth into Flatlands

What’s Wrong with the Coordinates at the North Pole?

Who Can Make the Best Coordinate System?

Copyright

© 2018 by Regents of the University of Colorado; original © 2017 University of Wyoming

Contributors

Jake Schell; Andrea Burrows

Supporting Program

University of Wyoming

Acknowledgements

This digital library curriculum was developed under the guidance of Andrea Burrows, Linda Hutchinson, and Michele Chamberlin at the University of Wyoming.

Last modified: June 10, 2019

Hands-on Activity Geometry and Geocaching Using GIS & GPS

Quick Look

Grade Level: 7 (6-8)

Time Required: 2 hours 30 minutes

This activity requires substantial preparation time beyond the 150-minutes activity time so that students execute the procedure correctly.

Expendable Cost/Group: US $0.00

This activity uses some non-expendable (reusable) items; see the Materials List.

Group Size: 4

Activity Dependency: None

This activity requires the resource(s):

A graphic shows the label for an official geocache artifact. It is a green label with black lettering and the official geocache emblem—a cartoon of a person tracking towards a waypoint flag searching for a hidden treasure. Users are required to submit the cache name, contact name, and info.
An official geocache label that people affix to the hidden container to provide cache contact information.
copyright
Copyright © 2012 Lee Cannon, Flickr CC BY-SA 2 https://www.flickr.com/photos/leecannon/6924688841

Summary

Students take on the role of geographers and civil engineers and use a device enabled with the global positioning system (GPS) to locate geocache locations via a number of waypoints. Teams save their data points, upload them to geographic information systems (GIS) software, such as Google Earth, and create scale drawings of their explorations while solving problems of area, perimeter and rates. The activity is unique in its integration of technology for solving mathematical problems and asks students to relate GPS and GIS to engineering.

Engineering Connection

Students act as civil engineers, modeling a public works project. By working with GPS technology, students learn how engineers can mark locations with data and map that information using GIS software. Engineers use satellite imaging and GIS principals, and the activity demonstrates the broader use of these tools in engineering applications. Students also make connections to specific elements of mathematics that engineers may use, such as applying unit rates to determine how much material engineers need to complete a project.

Learning Objectives

After this activity, students should be able to:

  • Use GPS technology to locate points given a latitude and longitude to determine locations on Earth and store those points digitally by transferring latitude and longitude data from a GPS to GIS (Google Earth).
  • Solve problems involving scale drawings of geometric figures, including computing actual lengths and areas from a scale drawing and using appropriate tools such as a protractor.
  • Explain how GPS and GIS relate to engineering.
  • Solve problems related to angle measurements and angle relationships, such as complementary, supplementary and triangle and quadrilateral angle relations.

Materials List

Each group needs:

  • GPS-enabled device (most smartphones are equipped with GPS receivers)
  • GPS app such as Free GPS (for Apple iOS) or Maverick: GPS Navigation or Handy GPS (for Android)   
  • computer or other device with an internet connection and Google Earth software installed (or the capability to install the software)
  • Appendix A: Student Activity Handout
  • protractor
  • ruler

For the class to share:

Worksheets and Attachments

Visit [www.teachengineering.org/curriculum/print/uow-2262-integrating-gis-mathematics-engineering-gps] to print or download.

Pre-Req Knowledge

Ability to calculate area of various polygons, both regular and irregular. Ability to use a protractor and have a basic understanding of how a compass works. This activity is associated with the GIS, Mathematics and Engineering lesson.

Introduction/Motivation

A graphic word cloud that shows a variety of words related to GIS. Larger words are information, geoinformatics and science.
A word cloud of terms relating to GIS and GPS.
copyright
Copyright © 2012 Environmental Informatics Marburg, Flickr CC BY-NC-SA 2.0 https://www.flickr.com/photos/environmentalinformatics-marburg/8839279513

In the associated lesson, GIS, Mathematics and Engineering, you became familiar with GIS and GPS as well as some of the more practical mathematical and engineering applications associated with those systems. In today's activity, you will explore these technologies further by playing the hybrid role of civil engineers and geographers. You will use GIS and GPS devices to participate in a geocache hunt! These caches are located within a predefined space outside and your job is to navigate between them using GPS and math. Be prepared to do your own mapping while tracking your movements and viewing satellite images of your journey into geocaching! As part of this challenge, you will find a latitude and longitude on your GPS, mark waypoints, solve geometry and unit rate problems, upload GPS data to a GIS, and take on the role of engineers!

Civil engineering is primarily about designing infrastructure and making it sustainable for public use. Because engineers use an immense amount of information in planning infrastructure, GIS technologies provide them with tools to analyze and visualize these data. By playing the role of civil engineers, your task, on a smaller scale, is to help improve access to an area of public land. You will analyze information in order to design the perimeter of a new green space surrounded a fence that encloses all or part of the defined property.

Additionally, you will design a brick pathway within the fenced-in area and calculate the number of bricks necessary for the path. You will receive more information as we go over the instructions.

By the time you finish this challenge, you will: have transferred data from a GPS device to GIS software; tracked and located geocaches; created scale drawings of your journey; calculated the area within the boundaries of your exploration; and designed sidewalks and fences, all while taking into account materials through an engineering lens.

Procedure

Background

Refer to the associated lesson, GIS, Mathematics and Engineering, for key contextual background and instruction on GPS, GIS, and waypoints.

Before the Activity

Note: this activity requires a substantial amount of setup; however, feel free to modify the procedure to fit your needs.

  • Locate a large area (suggested minimum of a hectare, or 10,000m2) to set up the GPS activity. Soccer, baseball, and football fields suffice if no easy access to green space near the school is available, but a slightly larger area is required to follow the exact relative locations of waypoints laid out in the example provided. Modify the example to fit your constraints.
  • Create your geocaches and label them with a name. Each geocache contains math problems, located in Appendix C: Problems for Geocaches, for students to solve for unknown angle values. After solving each problem, they follow the “solution” angle to find the next geocache and make a waypoint. Use a small receptacle (plastic tub, folder, etc.) for each geocache. The waypoints from each geocache, when put into Google Earth, form the shape of an irregular pentagon, with each geocache representing a vertex.
  • The geocache problems in Appendix C: Problems for Geocaches match the recommended irregular pentagon seen in Figure 1. Placing the geocaches in a slightly more irregular shape makes the activity more challenging; however, depending on the angle from which one geocache is located relative to another, you may need to make modifications to your math problems. To make the activity more realistic, choose an area with trees, taller grass, rocks, or other cover within which to conceal the geocaches. See below for more information about the geocaches.
  • Plot your course using your GPS-enabled device and place your geocaches in the confines of your hectare area. Make sure the angle solutions located within each geocache correspond to the location of the next geocache (or geocaches). Also, choose a waypoint near geocaches from which each group can start. Later, upload these waypoints from the GPS device into Google Earth.   
  • Most smartphone-based GPS devices do not guarantee accuracy greater than 5 meters. With this in mind, aim to keep each geocache location as far away from each another as is reasonable, ideally no closer than 40 meters apart at a minimum. The margin for error in this activity is limited by the accuracy of the equipment as well as with Google Earth.
  • Be sure to have enough GPS-enabled devices and corresponding computers to access the Google Earth program per group. (Download a free copy of Google Earth for the classroom computers.) As necessary, alter group size to accommodate the number of GPS devices in each class. Students may use either smartphones or dedicated GPS units, but the teacher needs to be able to troubleshoot and plan for each technology type. Ideally, find/borrow enough Apple and/or Android smartphones to use in the classroom; because this is the most likely scenario, the following tutorial uses those platforms.
  • To start the activity, each group receives a waypoint (latitude/longitude) to input into their GPS device. For this reason, a larger polygon of five sides or more helps with group distribution around the activity zone. Try to spread the groups out amongst the geocaches as evenly as possible. To create a waypoint (or “placemark”) in Google Earth, simply click on the thumbtack icon in the top navigation bar, click and drag the tack to the desired location, and type in a name and notes. See Figure 1.

A satellite photo shows several fields with a track as seen from the software program Google Earth. Additionally, portions of the interactive parts of the software are highlighted with hints drawn in.
Figure 1. How to use waypoints in Google Earth.
copyright
Copyright © 2017 Jake Schell, University of Wyoming

  • Share with each group the latitude and longitude waypoint it needs to start the GPS activity at its location. Have students complete Appendix D: Group Members Latitude and Longitude Log with each group member’s name and starting latitude and longitude. In Google Earth, waypoints show up in the “Places” bar on the left-hand side of the screen. To edit, right click on the waypoint name in the map (or in the “Places” bar) and click on “Get Info.” See Figures 1, 2 and 3.

A satellite photo shows several fields with a track as seen from the software program Google Earth. The image shows the dialogue box that appears when right clicking on Qaypoints, so users can access various commands, such as “Get Info.”
Figure 2. How to get data from Waypoints in Google Earth.
copyright
Copyright © 2017 Jake Schell, University of Wyoming

A screen capture shows the “Get Info” dialogue box for Qaypoints in Google Earth. Data includes the name, latitude and longitude, and notes for the waypoint.
Figure 3. The “Get Info” dialogue box in Google Earth.
copyright
Copyright © 2017 Jake Schell, University of Wyoming

  • Remember, if you do not set up your geocaches from this example, you must create word problems that result in angle measurements and distances for students to follow in order to move from geocache to geocache. For this reason, consider using the pentagon above and associated problems from Appendix C: Problems for Geocaches. An example of the activity’s flow by solving math problems and moving from location to location is as follows: Assume that a group is starting at the waypoint “Geo 1,” and you want them to proceed to the waypoint “Geo 2.” The problem provided at “Geo 1” needs to result in a solution of 90 degrees, because the group needs to move at a compass bearing of 90 degrees (or due east) to arrive at the next waypoint (assuming they were being asked to go in order). As an example, the question could read:
    1. Two angles are complementary. What is the sum of their angle measures?
    2. The area of a rectangle is 405 meters. The width of the rectangle is 3 meters. What is its length?

The answers to these questions (90 degrees and 135 meters, respectively) tell the students how far and in what direction to walk to the next geocache. 

  • Following the geocache activity, the students' focus shifts from one of GPS and GIS expert to that of civil engineers. The engineera are designing some brick walkways and a fence for part of the perimeter. The designs are limited to the shapes formed by the locations of each geocache location; however, following the example above, imagine the brick walkway forms a border around the perimeter of the rectangular section of the pentagon, with two paths crossing going east-west and north-south through the middle of the rectangle (see Appendix B Civil Engineering Calculation). The walkway needs to be 2 meters wide and each brick covers 1/9 square meters. Students need to calculate how many bricks are required for engineers to complete the project. Based on the shape you create, alter the path size and shape to suit your needs. See Appendix B Answer Key for a sketch of this scenario. You may want to create a shape for the fence or permit students to design a fence, which is a nice way to scaffold the activity. You may also alter the pathway and fence constraints if you so choose. For the example provided, the engineers are only fencing off the triangular portion to the east and are placing fence posts every 1 5/6 meters.

With the Students

Day 1

Part 1. Introduction:

  1. Hand out the Appendix A: Student Activity Handout, considering any necessary changes to fit your class/school, and arrange students in groups for the activity. Have students continue to refer to the activity handout through the duration of the activity.
  2. Read the Introduction/Motivation section with the class and provide background for the geocache activity.
  3. Go over the challenge/activity instructions.

Part 2. Navigating the Geocaches

  1. Refer students toward the latitude and longitude for their first geocache and navigate to new geocaches and GPS coordinates by solving math problems. Each student needs a pencil to work out the problems in the field. Each group starts at different locations, which will be Geocache 1 in their handouts.
  2. Hand out to each group the papers (from Appendix D Group Members Latitude and Longitude Log) with the latitude and longitude of the geocaches.
  3. Direct students to copy down the latitude and longitude Geocache 1 in their student handout sheets. Direct students to look at the geocache locations in the handout and solve the two geometry problems located within each geocache. Space is provided to work out each problem. One answer tells the team what direction, such as an angle or compass bearing, to walk to find the next geocache, and the other answer provides the distance to travel in meters. Remind students any errors will keep them from finding the next geocache, so be mindful!
  4. Once a group finds the next hidden geocache location, they make a new waypoint in the GPS device and copy the geocache name as well as its latitude and longitude into the worksheet. Teams know they have finished when they arrive back at the location where they started. Once all the geocaches are found, have students return to class to work on Appendix A: Student Activity Handout.

Day 2

Part 3: Scaling Down

  1. In the second part of the activity, students assume the role of civil engineers. In this role, their supervisor wants to know the area that is contained by the geocaches so they can make improvements upon a parcel of public land. They also want to see a sketch of the area, to scale. So, students’ job is to calculate how much material they need for a few projects associated with this improvement project.
  2. Direct students to export the waypoints from your GPS device into Google Earth, just as they did in their activity.
  3. Draw a scale representation of the shape on graph paper. Find this in the student activity handout section titled Scaling Down. Have students calculate the area of the shape they created and include the scale and the distances represented by their drawing, since the objective is to make an accurate scale drawing of the perimeter created by their geocaches. Students can divide the area into polygons as a way to calculate their areas. Note that they are calculating the true area represented on the surface of the earth, not the area on the paper.
  4. Explain how to construct the sidewalk and fence areas. If you followed the example provided in the teacher preparation portion of this activity along with the Appendix B Answer Key, this is relatively simple. Again, this is a great place to provide extensions or scaffolding. Will students create their own fences and pathways, or will they follow a set design such as the one provided with the activity? Some students benefit from a set, guided pathway, while others can extend the lesson by designing their own. You may want to wait until you get back in from the field to convey this information.

Part 4: Activity Summary

To summarize, below is the outline of what the student engineers will be doing:

  • We will go into the field and mark our geocaches with waypoints on the GPS. We will navigate between geocaches by answering the geometry questions contained within them, which will provide us with a distance and direction to walk to the next location.
  • We will use the information above and our GPS units to find all of the geocaches.
  • Acting as engineers, we will upload our waypoints into Google Earth, a GIS platform.
  • We will draw a scale version of the track we made on graph paper in the handout.
  • We will then calculate the area of earth contained within our track.
  • We will design or draw a pathway through the area and a fence for all or part of the perimeter, calculating the necessary amount of materials to build these features.

Vocabulary/Definitions

coordinate: The combination of longitude and latitude, along with elevation, make a GPS coordinate which defines a single point on the surface of the earth.

geographic information system: A way to store, edit, and manipulate data or information, usually using maps; commonly referred to as GIS.

Global Positioning System: A satellite based navigation system that allows users to determine their position on the earth, among other uses; commonly referred to as GPS. More broadly, GPS can refer to any device used to locate a given position.

latitude: This represents an angle north or south of the equator, but is more easily understood as the y-coordinate of a location on the surface of the earth.

longitude: This represents an angle east or west of the prime meridian, but is more easily understood as the x-coordinate of a location on the surface of the earth.

waypoint: In the case of navigation, a fixed longitudinal and latitudinal coordinate or GPS point that identify a physical point.

Assessment

Pre-Activity Assessment

Formative Assessment from Discussion: During the lesson and activity introductions, gauge the level of familiarity students have with the technology at hand. This informal assessment may generate data that helps you establish groups. A group of students with no GPS or little map experience could be at a significant disadvantage, so heterogeneous groupings based on familiarity with the topic are advisable.

Activity Embedded Assessment

Waypoint Checks: Groups proceed through the geocache by correctly answering geometry problems. Therefore, a check of their geocache GPS coordinates tells the teacher whether they were correctly solving the problems during the GPS activity. However, teachers could also take up student or group work from the geocaching portion to grade separately. Have teams take a screen shot of their group’s Google Earth screen after all GPS waypoints have been uploaded and prior to moving on to Step 2 of “Scaling Down.” Students can submit these images or just check them off.

Post-Activity Assessment

Activity Handout: Grade Part 2 (“Scaling Down”) from the Appendix A: Student Activity Handout. Grading Part 1 (“Navigating the Geocaches”) is optional. Review of their work lets you know if students understood the technical and problem-solving portions of the activity.

Troubleshooting Tips

  • It is recommended that you familiarize yourself with all technology in advance.
  • In the event that the GPS does not send the information to the email account, either provide students with your own Google Earth Data, or have them work with another group’s data. Alternatively, have them manually input the latitude and longitude data into the waypoint through the “Get Info” tab after right clicking a waypoint (see Figures 2 and 3).
  • If upon opening the KML file from the email Google Earth does not open the file, click and drag the file directly into Google Earth. Release the mouse pointer over the map to load the waypoints.
  • If the app freezes or aborts, reset the device. On Apple devices, a hard reset may be required.

Activity Extensions

Any variety of extensions are possible, from creating different polygons to construction of different pathways or varying the engineering scope of the activity.

Have student groups research how civil, environmental, geophysical, and other engineers use GPS to monitor the motion of the earth. Possible applications for research include monitoring glacial growth and recession, plate tectonics, and landslides. Have teams create digital slide shows to present to the class.

Have students create their own shapes, fences, and walkway designs to solve for themselves or in groups.

Activity Scaling

  • For lower grades, simplify the activity by providing students with directions and distances to travel between geocaches, or remove calculations for materials and eliminate some of the higher-level math.
  • For higher grades, provide higher-level math content questions at each geocache, or model curved or traced paths from which students can build their paths.  

Additional Multimedia Support

Geographic Information Systems (GIS): Dan Scollon at TEDxRedding - TEDx Talks

How Does GPS Work? - sciBRIGHT

What Is GIS? - Esri

Using Your iPhone & Google Earth for Plot Mapping

Subscribe

Get the inside scoop on all things TeachEngineering such as new site features, curriculum updates, video releases, and more by signing up for our newsletter!
PS: We do not share personal information or emails with anyone.

References

Patton, K. The Fundamentals of GIS and Real World Application (PDF). Western Wyoming Community College.

Using Your iPhone & Google Earth for Plot Mapping (PDF). IR-4 Project, Department of Environmental

Toxicology, UC-Davis. http://wrir4.ucdavis.edu/Resources/Tricks/docs/GPSGoogleEarth%20Plot%20Mapping-iPhone.pdf.

Accessed September 25, 2018

GIS Solutions for Civil Engineering (PDF). ESRI. Accessed September 25, 2018. http://www.esri.com/library/brochures/pdfs/gis-sols-for-civil-engineering.pdf

Copyright

© 2018 by Regents of the University of Colorado; original © 2017 University of Wyoming

Contributors

Jake Schell; Andrea Burrows

Supporting Program

University of Wyoming

Acknowledgements

This digital library curriculum was developed under the guidance of Andrea Burrows, Linda Hutchinson, and Michele Chamberlin at the University of Wyoming.

Last modified: November 28, 2018

Hands-on Activity Topographic Maps and Ratios:
A Study of Denali

Quick Look

Grade Level: 7 (6-8)

Time Required: 1 hours 15 minutes

Expendable Cost/Group: US $0.00

Group Size: 2

Activity Dependency: None

This activity requires the resource(s):

A satellite image overlaid by a topographic map of Denali, the tallest peak in Alaska. Glaciers, snow and rock cover most of the mountain, while topographic (contour) lines show elevation. The area is characterized by steep areas and large basins formed by glaciers.
Topographic maps offer many uses and engineers must know how to navigate them. This Google Earth image shows a topographic map with satellite imagery of Denali, a peak in Alaska.
copyright
Copyright © 2017 Jake Schell, University of Wyoming

Summary

Students overlay USGS topographic maps into Google Earth’s satellite imagery. By analyzing Denali, a mountain in Alaska, they discover how to use map scales as ratios to navigate maps, and use rates to make sense of contour lines and elevation changes in an integrated GIS software program. Students also problem solve to find potential pathways up a mountain by calculating gradients.

Engineering Connection

Engineers use ratios, rates and GIS with great frequency and must be able to work with them in various forms. Often, engineers combine physical documents with technology to make the data easier to understand and manipulate. In addition, technology helps engineers increase efficiency and problem solve while simultaneously globalizing businesses and services. The concept of slope or gradient is ubiquitous in mathematics and applies to all STEM fields. For example, when designing a road in mountainous terrain, civil engineers analyze slope to make the road passable while considering costs, while environmental engineers simultaneously assess the slope and terrain type above and below the road for safety purposes.

Learning Objectives

After this activity, students should be able to:

  • Compute unit rates of contour lines.
  • Use rates to understand the growth of mountains.
  • Determine whether contour lines are proportional.
  • Calculate a grade (gradient/slope).

Materials List

Each group needs:

Worksheets and Attachments

Visit [www.teachengineering.org/curriculum/print/uow-2262-integrating-gis-mathematics-engineering-gps] to print or download.

Pre-Req Knowledge

Students should be familiar with ratios, rates, and proportional relationships, and be able to convert from fractions to percentages.

Introduction/Motivation

Consider what it takes to construct an aerial tram up the side of a mountain. What does it take to plan, design, integrate, and execute such a monumental feat of engineering? (Listen to student ideas.)

Construction of any infrastructure requires the collaboration of a variety of engineers, especially if, for example, they are working on something like an aerial tramway in a steep, rocky area like Jackson Hole, Wyoming. (To engage students in the challenge, show them the video on the construction of the Jackson Hole Aerial Tram.)

A photograph shows an aerial tram ascending above a snow-covered, rocky mountain. Far below in the distance is a docking building.
All over the world, aerial tramways are used for people to travel up steep peaks. What would you need to know if you were an engineer tasked with building one to take you to the top of Denali?
copyright
Copyright © 2015 Akiry, Wikimedia Commons CC BY-SA 4.0 https://commons.wikimedia.org/wiki/File:Les_Arcs_-_telepherique_aiguille_rouge.jpg

A photograph shows a winding road ascending through a valley and up a mountain. The road is made of several switchbacks that climb on top of each other, with large mountains in the background.
Steep passes are an impressive engineering feat. What kinds of problems would an engineer need to solve to build a pass like this one in southern France?
copyright
Copyright © 2012 xuuxuu, Pixabay, public domain https://pixabay.com/p-69363/?no_redirect

In order to think like an engineer and to wrap our minds around some of the phenomenal civil engineering that happens every day, we are going to use Google Earth along with some digital maps from the U.S. States Geological Survey to think about steepness and size of features on earth such as mountains. Think about our aerial tram example, and then imagine yourself driving over a mountain or a mountain pass. What kinds of engineering was required to design that road? How would people know where to build or where the easiest path lies? When you plan a trip and use a map to navigate, how do you know the distance between two points on the map? Have you ever seen two maps of the same area and compared the detail that goes into each map?

Part 2: In this image, the lines crossing the landscape are called “contour lines” and show surfaces of the earth that all lie at the same elevation, or distance above sea level. Lines above a given contour represent higher elevations and lines below represent lower elevations. Based on this concept, would you expect steeper parts of the mountain to have lines spaced closer together or further apart? Why?

(Show Google Earth image with a topographic map overlay, either from the top of this document or an electronic device.)

(Have students discuss the question in groups and share with the class. Expect students to figure out that steeper parts of the mountain have contour lines that are spaced closer together. Next, review what students will be doing in the activity by going over the Student Activity Sheet.)

In this activity, you will be taking on the role of engineers who need to build a tram up Denali, the highest peak in North America at 6,190 m (20,310 ft) above sea level. What would your main engineering challenges look like? How would you start problem solving for solutions? What kind of information would you need to know about the region in order to build a tramway there?

As the engineers, you will analyze the steepness of Denali using satellite imagery and contour maps. You need to use ratio and proportional reasoning skills to calculate slope (steepness) and analyze elevation. As you work through the activity, be thinking about everything you do from the lens of an engineer. Use your calculations throughout the activity to suggest a location for the tram based on the mountain topography. To summarize the engineering challenge:

  • First, familiarize yourself with Google Earth and set up the maps. Real-world engineers have more sophisticated software, but we can do a lot with free programs!
  • Next, calculate and analyze how scale affects what we see on the map. As you work through the activity, consider how scale is important to engineers.
  • Next, calculate gradients (slope) and determine the unit rate of each contour line interval.
  • Then use your newfound knowledge to analyze the ascent of two climbing groups, taking into account their locations and the topography they need to traverse to get to the top. Think about how this relates to your challenge to design the tramway route.
  • Next, use unit rates to think about how the mountain grows over time. This is the work that a geologist might undertake, but is also important information for engineers.
  • Finally, draw the path that you recommend the tram take up the mountain, and explain why you chose that route. Make sure to print the screen with the map showing your tram’s route. Either draw the route by hand or use the path tool in Google Earth.

Procedure

Background

Review the following concepts with students. Depending on your students' base understanding of these terms, you may want to spend more or less time here. Provide students with their handouts and display Google Earth to the class for reference.

Ratio:  A comparison of two of more numbers. Can be shown as a:b, a to b, or a/b. The value of a ratio is the number we get when we divide a by b.

Proportion/proportional relationship: A relationship or equation showing that two or more ratios are equivalent, or have the same value. All of the following ratios are equivalent (equal to 0.5 as a decimal), so the relationship between them is proportional. Example: 1/2 = 2/4 = 5/10.

Scale: A scale is simply a ratio (typically shown as 1:x) describing a proportional relationship between the dimensions of an actual object and some model representation of the object. Typically, we write the ratio as model:actual. On a map of the United States, you may see a scale such as 1 in: 300 mi. This means that each inch on the map represents 300 miles on the surface of the earth.

Refer to Part 2 of Student Activity Sheet called “Determining Scale,” for information about scale as it pertains to Google Earth. Google Earth, like all maps, uses scale to represent distances in real life as distances on the map. Different maps have different scales. Google Earth gives its scale in the form of a bar on the lower left of the screen. (You can display this bar in Google Earth settings.) The scale changes when you move the screen around, or when you zoom. Write scale as a ratio comparing the map distance to the real-world distance.

Note that scale does not have units because the units cancel out when written as a fraction. This scale works because it uses the same units on the map as in real life. If the scale is 1:4, then 1 inch on the map equals 4 inches in real life and 1 centimeter on the map equals 4 centimeters in real life. For this activity, do not include units in your scale.

Rate: A rate is a ratio comparing quantities with different units. We often use the word “per” instead of “to” when describing rates. For example, “1 inch per 300 miles on this map” or “300 miles per inch.”

Contour Lines: Refer to Part 3 of Student Activity Sheet, “Contour Lines and Gradient (Slope).” Topography maps enable users to determine elevation, which means the vertical distance a point is above sea level, and is represented by the small numbers on the lines in the map called contour lines. Using unit rates enables users to learn the elevation change between each line. Unit rates are determined by division, with the small numbers representing elevation in feet above sea level.

Slope: A slope is the value of the ratio of the vertical change to the horizontal change of two quantities. Slope coincides with the steepness of the mountain between any two points on the map, and can be shown as a fraction or decimal equivalent. A slope of 4/5 means that for every 4 meters of elevation you go up the mountain, you are moving horizontally 5 meters.

Grade (or Gradient): This is the equivalent percentage of a given slope. If the slope between two points on the mountain is 4/5, the decimal equivalent is 0.8. To convert between a decimal and a percentage, multiply by 100, so the gradient is 80%. The steepest mountain passes for vehicles are typically around 10%.

Before the Activity

Familiarize yourself with the Google Earth GIS platform and experience the USGS topographic map enhancement feature with the KMZ file. Display data in Google Earth in metric units from the view panel in the top of the screen. Click “Google Earth” (labeled as “Google Earth Pro” in the Figure 1), click preferences, and choose meters, kilometers under “Units of Measurement.” Secure electronic devices with internet connections and make copies of the Student Activity Sheet, one per student.

Determine whether students need to download Google Earth onto the devices they will be using. Determine whether the devices already have the software or if students will be able to download the software they need (many downloads are password protected).

This is a screenshot of the preferences tab in Google Earth, showing how to change the units of measurement in the program.
Figure 1. How to change the units of measurement to metric in Google Earth.
copyright
Copyright © 2017 Jake Schell, University of Wyoming

With the Students

  • Divide the class into groups of two or three students each; paris are preferable but the number of devices available may dictate the group size.
  • Hand out the Student Activity Sheet to each student and a ruler to each group.
  • Have students download the KMZ file NGS Topo 2d from https://www.arcgis.com/home/item.html?id=d591ee08318e4d4389ed7beaa9cd7e87.
  • Have students open the site and click Google Earth under the heading “View In” at the very top of the page. Then a KMZ file begins to download.
  • Once the KMZ file is downloaded, expect it to load in Google Earth. If not, look for a pane on the left-hand side of the program called “Places.” This enables you to toggle the new file on and off with a checkmark. When the file downloads, it may be located under the tab “Temporary Places.” See Figure 2.
  • Have students  set Google Earth to display information in metric units (kilometers) and show the scale bar. To set this preference, click on the Google Earth heading (shown as Google Earth Pro in Figure 1) and then click on Preferences. From within the preferences dialogue box, set the units to kilometers. To show the scale bar, click on “View” the top pane and make sure a checkmark is placed at “Scale Legend.”
  • Familiarize students with maneuvering through Google Earth by discussing the first section of the Student Activity Sheet as a class and work through the rest of the activity as a class.

An image of Denali and its surrounding area with USGS topographic map overlays. Most of the area is colored in white and brown indicating snow and steep terrain. The image highlights the pane viewers see in Google Earth showing the places, layers, and search box with standard navigation tools across the top such as File, Edit, View, etc.
Figure 2. Make sure the checkmark next to the file NGS_Topo_US_2D is marked for the file to load. It may be located under Temporary Places on your device.
copyright
Copyright © 2017 Jake Schell, University of Wyoming

Vocabulary/Definitions

contour lines: Lines on a topography map that designate areas that have the same elevation, or vertical distance above sea level. Different maps have different unit rates per contour line, such as 200 m between each contour line.

geographic information system: A way to store, edit, and manipulate data or information, usually using maps; commonly referred to as GIS.

grade: The equivalent percent of a given slope.

rate: Ratio that compares numbers with different units, such as miles per hour.

ratio: Comparison of two or more numbers, commonly written as a fraction. Ratios can be written in three ways: a to b, a/b, or a:b.

scale: Ratio (typically shown as 1:x) describing a proportional relationship between the dimensions of an actual object and some model representation of the object.

slope: Value of the ratio when comparing the vertical change to the horizontal change of two quantities. Slope coincides with the steepness of the mountain between any two points on the map, and can be shown as a fraction or decimal equivalent.

topography map: Sometimes referred to as a “topo” map; shows different elevations, or relief, by way of contour lines or other means. These maps may also show significant geographic points such as roads, peaks, and rivers.

Assessment

Pre-Activity Assessment

Discussion Questions: Take note of responses to the discussion questions in the introduction, which could suggest complementary student grouping.

Activity Embedded Assessment

Activity Sheet: Have students complete the Student Activity Sheet. Grade the work either by group or individually. 

Post-Activity Assessment

Reflection Questions: Ask students the following questions:

  1. What did you learn in the activity about engineering as it relates to using topographic maps and contour lines?
  2. In what situations would engineers building a tram want to use a large-scale map (more detail) and in what situations would they want to use a smaller scale (see less detail)?
  3. What, if anything, is different about the engineers’ route up the mountain from those of the climbers? How does this relate to slope?
  4. Besides slop, what other factors might engineers consider that would influence tram placement?

Troubleshooting Tips

  • If the USGS topographic map overlay file is not displaying in Google Earth, try double clicking on it in the “Places” pane on the left-hand side of the screen. This causes it to zoom out and load the file. From here, you may need to locate Alaska and slowly zoom in on it and locate Denali manually instead of zooming in on it from the search tool. As you slowly zoom in, stop frequently to let the topo map overlay load before zooming in further. 
  • If the map overlay is not displaying the “Places” pane, manually click and drag the file from the save location into Google Earth. Release the mouse over the map portion of the program.

Activity Extensions

Emphasize the connections of this activity to engineering, a variety of extensions are possible. Consider the following ideas: Different groups could be assigned to take on the role of different types of engineers to put forth more effort into the tram (or road) design in a rocky, mountainous area. Instead of just using this idea as an opening or short write-up as seen in Part 5 of the activity sheet, consider spending a few days doing more research on real-world engineering feats and have students problem solve. They could create a model of a mountain pass for a railway or tramway with different groups researching the different engineering aspects of the project.

Activity Scaling

  • For lower grades, modify the ratios to involve fewer unit conversions.
  • For higher grades, focus more on slope. You could potentially have students graph a cross-section of various portions of the mountain to get an idea of the different slopes of the peak, perhaps following popular climbing routes.

Subscribe

Get the inside scoop on all things TeachEngineering such as new site features, curriculum updates, video releases, and more by signing up for our newsletter!
PS: We do not share personal information or emails with anyone.

Copyright

© 2018 by Regents of the University of Colorado; original © 2017 University of Wyoming

Contributors

Jake Schell; Andrea Burrows

Supporting Program

University of Wyoming

Acknowledgements

This digital library curriculum was developed under the guidance of Andrea Burrows, Linda Hutchinson, and Michele Chamberlin at the University of Wyoming.

Last modified: June 17, 2021