Quick Look
Grade Level: 11 (10-12)
Time Required: 6 hours 45 minutes
(eight 50-minute sessions)
Expendable Cost/Group: US $0.00 This activity also uses some non-expendable (usable) items; see the Materials List for details.
Group Size: 3
Activity Dependency: None
Subject Areas: Geometry, Measurement, Problem Solving, Science and Technology
NGSS Performance Expectations:

| HS-ETS1-2 |
Quick Look 

- Grade Level:
- 11 (10 – 12)
- Time Required:
- 6 hours 45 minutes
(eight 50-minute sessions)
- Group Size:
- 3
- Subject Areas:
-
Geometry Measurement Problem Solving Science and Technology -
NGSS Performance Expectations:
HS-ETS1-2

Summary
Challenged with a hypothetical engineering work situation in which they need to figure out the volume and surface area of a nuclear power plant’s cooling tower (a hyperbolic shape), students learn to calculate the volume of complex solids that can be classified as solids of revolution or solids with known cross sections. These objects of complex shape defy standard procedures to compute volumes. Even calculus techniques depend on the ability to perform multiple measurements of the objects or find functional descriptions of their edges. During both guided and independent practice, students use (free GeoGebra) geometry software, a photograph of the object, a known dimension of it, a spreadsheet application and integral calculus techniques to calculate the volume of complex shape solids within a margin of error of less than 5%—an approach that can be used to compute the volumes of big or small objects. This activity is suitable for the end of the second semester of AP Calculus classes, serving as a major grade for the last six-week period, with students’ project results presentation grades used as the second semester final test..")
Engineering Connection
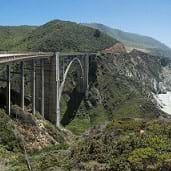
Problem solving within the constraint of available resources is an important engineering skill. In this activity, by using simple resources (digital photography and free geometry software), students create a blueprint (a good side-view photo) of a complex solid of revolution, and on this blueprint—using an appropriate scale factor—estimate its dimensions, which can be used to calculate volume and/or surface area. Knowing the volume of an object and its material’s density, the object’s weight can be determined. Using this approach, engineers solve the problem of determining the weight of an object of circular cross section that cannot be put on a scale (Figure 1) with no more information than its material density and its profile image.
 People walk by the bronze Tsar Bell in Moscow, Russia, which is more than 20 feet tall. (right) A large spherical stone finial on the gatepost of a Georgian house in Aberdeenshire, Great Britain.")
Learning Objectives
After this activity, students should be able to:
- Use technology to create a blueprint for a complex symmetric solid.
- Use technology to perform indirect measurements of a complex-shaped object.
- Use scale factors to transform blueprint measurements into real dimensions of an object.
- Use integral calculus formulas to find the volume of a solid of complex shape that can be classified as a solid of revolution or a solid with known cross section.
- Use a spreadsheet application to numerically evaluate integrals.
- Use a spreadsheet application’s graphing capabilities to visualize the revolving line of a solid of revolution.
Educational Standards
Each TeachEngineering lesson or activity is correlated to one or more K-12 science,
technology, engineering or math (STEM) educational standards.
All 100,000+ K-12 STEM standards covered in TeachEngineering are collected, maintained and packaged by the Achievement Standards Network (ASN),
a project of D2L (www.achievementstandards.org).
In the ASN, standards are hierarchically structured: first by source; e.g., by state; within source by type; e.g., science or mathematics;
within type by subtype, then by grade, etc.
Each TeachEngineering lesson or activity is correlated to one or more K-12 science, technology, engineering or math (STEM) educational standards.
All 100,000+ K-12 STEM standards covered in TeachEngineering are collected, maintained and packaged by the Achievement Standards Network (ASN), a project of D2L (www.achievementstandards.org).
In the ASN, standards are hierarchically structured: first by source; e.g., by state; within source by type; e.g., science or mathematics; within type by subtype, then by grade, etc.
NGSS: Next Generation Science Standards - Science
| NGSS Performance Expectation | ||
|---|---|---|
|
HS-ETS1-2. Design a solution to a complex real-world problem by breaking it down into smaller, more manageable problems that can be solved through engineering. (Grades 9 - 12) Do you agree with this alignment? |
||
| Click to view other curriculum aligned to this Performance Expectation | ||
| This activity focuses on the following Three Dimensional Learning aspects of NGSS: | ||
| Science & Engineering Practices | Disciplinary Core Ideas | Crosscutting Concepts |
| Design a solution to a complex real-world problem, based on scientific knowledge, student-generated sources of evidence, prioritized criteria, and tradeoff considerations. Alignment agreement: | Criteria may need to be broken down into simpler ones that can be approached systematically, and decisions about the priority of certain criteria over others (trade-offs) may be needed. Alignment agreement: | |
Common Core State Standards - Math
-
Make sense of problems and persevere in solving them.
(Grades
K -
12)
More Details
Do you agree with this alignment?
-
Reason abstractly and quantitatively.
(Grades
K -
12)
More Details
Do you agree with this alignment?
-
Model with mathematics.
(Grades
K -
12)
More Details
Do you agree with this alignment?
-
Attend to precision.
(Grades
K -
12)
More Details
Do you agree with this alignment?
-
Apply geometric concepts in modeling situations
(Grades
9 -
12)
More Details
Do you agree with this alignment?
-
Use volume formulas for cylinders, pyramids, cones, and spheres to solve problems.
(Grades
9 -
12)
More Details
Do you agree with this alignment?
-
Use geometric shapes, their measures, and their properties to describe objects (e.g., modeling a tree trunk or a human torso as a cylinder).
(Grades
9 -
12)
More Details
Do you agree with this alignment?
-
Apply geometric methods to solve design problems (e.g., designing an object or structure to satisfy physical constraints or minimize cost; working with typographic grid systems based on ratios).
(Grades
9 -
12)
More Details
Do you agree with this alignment?
-
Visualize relationships between two-dimensional and three-dimensional objects
(Grades
9 -
12)
More Details
Do you agree with this alignment?
-
Solve linear equations and inequalities in one variable, including equations with coefficients represented by letters.
(Grades
9 -
12)
More Details
Do you agree with this alignment?
-
Define appropriate quantities for the purpose of descriptive modeling.
(Grades
9 -
12)
More Details
Do you agree with this alignment?
International Technology and Engineering Educators Association - Technology
-
Students will develop an understanding of the characteristics and scope of technology.
(Grades
K -
12)
More Details
Do you agree with this alignment?
-
Students will develop an understanding of the role of troubleshooting, research and development, invention and innovation, and experimentation in problem solving.
(Grades
K -
12)
More Details
Do you agree with this alignment?
-
Students will develop an understanding of the attributes of design.
(Grades
K -
12)
More Details
Do you agree with this alignment?
-
Students will develop an understanding of engineering design.
(Grades
K -
12)
More Details
Do you agree with this alignment?
-
Students will develop an understanding of the relationships among technologies and the connections between technology and other fields of study.
(Grades
K -
12)
More Details
Do you agree with this alignment?
State Standards
Texas - Math
-
use scale factors with two-dimensional and three-dimensional objects to demonstrate proportional and non-proportional changes in surface area and volume as applied to fields;
(Grades
9 -
12)
More Details
Do you agree with this alignment?
-
apply mathematics to problems arising in everyday life, society, and the workplace;
(Grades
9 -
12)
More Details
Do you agree with this alignment?
-
use a problem-solving model that incorporates analyzing given information, formulating a plan or strategy, determining a solution, justifying the solution, and evaluating the problem-solving process and the reasonableness of the solution;
(Grades
9 -
12)
More Details
Do you agree with this alignment?
-
select tools, including real objects, manipulatives, paper and pencil, and technology as appropriate, and techniques, including mental math, estimation, and number sense as appropriate, to solve problems;
(Grades
9 -
12)
More Details
Do you agree with this alignment?
-
communicate mathematical ideas, reasoning, and their implications using multiple representations, including symbols, diagrams, graphs, and language as appropriate;
(Grades
9 -
12)
More Details
Do you agree with this alignment?
-
create and use representations to organize, record, and communicate mathematical ideas;
(Grades
9 -
12)
More Details
Do you agree with this alignment?
-
analyze mathematical relationships to connect and communicate mathematical ideas; and
(Grades
9 -
12)
More Details
Do you agree with this alignment?
-
display, explain, or justify mathematical ideas and arguments using precise mathematical language in written or oral communication.
(Grades
9 -
12)
More Details
Do you agree with this alignment?
-
apply the formula for the area of regular polygons to solve problems using appropriate units of measure;
(Grades
9 -
12)
More Details
Do you agree with this alignment?
-
apply the formulas for the total and lateral surface area of three-dimensional figures, including prisms, pyramids, cones, cylinders, spheres, and composite figures, to solve problems using appropriate units of measure; and
(Grades
9 -
12)
More Details
Do you agree with this alignment?
-
apply the formulas for the volume of three-dimensional figures, including prisms, pyramids, cones, cylinders, spheres, and composite figures, to solve problems using appropriate units of measure.
(Grades
9 -
12)
More Details
Do you agree with this alignment?
Materials List
Each group needs:
- personal computers, one per student, with GeoGebra, Microsoft® Excel® and PowerPoint® installed; download GeoGebra (free) mathematics software at https://www.geogebra.org/download
- Activity Pre-Quiz, one per student
- Estimating Volumes Project Rubric, one per student
- CoolingTowerImages.zip (jpg pictures), one per computer (in digital format)
- a camera, such as a cell phone
- a spherical object that can be measured with a vernier caliper, such as a tennis ball, baseball or large marble (see Figure 4); a more complex object like an egg can also be used; alternatively, if no spherical object or no vernier caliper is available, use the provided photograph of a marble sphere (MarbleSphere.jpg) as the practice object
- vernier caliper
- ruler
For the teacher:
- computer with projector and Internet access, to show students photos and two online video animations
Worksheets and Attachments
Visit [www.teachengineering.org/activities/view/ind_complex_solids_activity1] to print or download.Pre-Req Knowledge
A familiarity with concepts such as:
- Solids of revolution
- Solids of known cross sections
- Computing volumes of solids of revolution (disc method) or of known cross sections using integral calculus
- Computing definite integrals using the trapezoidal rule for non-uniform partition (numerical integration)
- Equations to compute areas/volumes of regular shapes/solids
- Scale factor
Students should also be familiar with:
- GeoGebra (free) mathematics software
- Microsoft® Excel® and PowerPoint®
- Transferring digital images from a camera to a computer
Introduction/Motivation
To compute the volumes of regular solids, we have a set of well-known formulas. Using these equations, the volumes of cones, cylinders, spheres, right prisms and pyramids are easily computed if we know the dimensions of radius, height or length.
Using integral calculus, we can compute the volume of more complex solids, provided they are solids of revolution or solids with known cross sections, and the edge or revolving line of the solids can be expressed as a function. When it is not possible to solve the involved integral or when only values (xi, f(xi)) of the function are given, we can apply numerical techniques like the trapezoidal rule.
However, how can the volume of an object like a finial (Figure 2-left) be computed? Even though a finial is a solid of revolution, no function exists to model the complex shape of its revolving line, and measuring points along its edge is not easy. Even for a simpler solid, such as an egg (Figure 2-right), it is challenging to take measurements of it. What to do?
, 11 dots around half its right perimeter, and mathematical notations of xi, f(xi) and (xi, f(x1i).")
(At this point, slightly change topics to bridge the mathematical concepts to real-world concepts and a challenge.)
What do you think is the most important technological advancement or engineering achievement of the 20th century that is necessary in your daily life? (Write student answers on the classroom board. Expect answers to vary, but likely include computers, telephones, microchips, software, airplanes, Internet, television, etc. Put a box around the answer that most of the class agrees with. Next, refer to the following NAE web page at http://www.greatachievements.org/.) As stated by the National Academy of Engineering in its list of the “Greatest Engineering Achievements of the 20th Century,” electrification is the most important technological advancement of the last century. Without electricity, practically none of the other developments would work!
How is electricity generated? (Direct students to hold brief group discussions and write student answers on the board. Expect one common answer to be that electricity is generated in power plants. To clarify the power plant electricity generation process, show the 4:47-minute animation, How Nuclear Power Plants Work / Nuclear Energy.) Let’s watch this video animation to learn about the power plant electricity generation process.
(Near the end of the video, at minute 4, the role of the cooling towers is mentioned; make sure students comprehend some key points about nuclear power plant cooling tower structures.) Cooling towers are tall, hollow structures inside which steam is condensed, or water that is used as a coolant in some industrial processes is left to cool for reuse by trickling down a surface. Cooling towers are shaped like this (show a photograph such as Figure 3, or sketch the shape on the board) so that they can support their own weight. If they were ordinary cylinders, they could buckle and collapse. A hyperbolic shape efficiently meets the cooling tower requirements.

(To clarify the role and function of cooling towers, show the 2:16-minute animation: Cooling Tower / Stack Effect / Natural Convection.) Let’s watch this video animation to learn about the role and function of cooling towers.
(Show students a photograph of cooling towers, such as Figure 3.) Imagine that you are civil engineers working for the big energy company that provides electricity to your city, and you are assigned to the maintenance department. It is time to make some repairs and paint one of the power plant cooling towers, so you need to consult the structures’ blueprints because in two days, you need to provide some estimates during a meeting with the company’s maintenance manager to authorize your budget.
A long time ago these blueprints were scanned and the electronic files were saved on magnetic tapes. But when you try to open these files, they are corrupted and impossible to recover. You are in critical situation because you don’t have enough information to even estimate the cooling towers’ volumes. It’s not simple, it’s time consuming, and it is expensive to measure the structures directly. The only information you have is from the power plant web page: the cooling tower height, and a photograph of it. What to do?
(Ask students to brainstorm some possible solutions to this problem. Write their answers on the board and conduct a discussion of possible solutions to the described scenario. Explain that in the activity, students will begin by estimating the cooling towers’ volumes and work toward estimating the surface areas to solve the engineering challenge.)
Procedure
Background
Students have been assigned to compute the volumes of regular solids since elementary school, learning well-known equations to determine the volumes for cubes, cylinders, cones, spheres, prisms, etc. In calculus, students learn new techniques to compute volumes of solids with more complex shapes, since many of these solids are solids of revolution or solids with known cross sections.
We also know a functional expression for the revolving line or for the cross-section area. Integral expressions like the following can be evaluated analytically or numerically.
dx. Equation for the volume of solids of known cross section = V = the integral from a to b of A(x)dx.")
Unfortunately, when a solid has a complex shape, such as a furniture leg (see Figure 2-left), an analytical expression for its revolving line does not exist, so it is not possible to evaluate the above integrals to find the volume.
But, if we had a data table with (x, y) points on this line, y = f (x) measured from the axis of symmetry, the integral expression could be approximated using these values and the trapezoidal rule:
dx is approximately equal to ((b-a)/2n))x{f(x0)+2f(x1)+…+2f(xn-1)+f(xn)}. Non-regular n-partition = the integral from a to b of f(x)dx is approximately equal to ½ times the sum from i=1 to n of (f(xi-1))+f(xi)) times (xi-xi-1)).")
However, to manually obtain a trustworthy set of measurements of the solid’s width along its axis of revolution is not a simple task (see Figure 2). The complex form of the edge makes it difficult to use a ruler or a vernier caliper.
To overcome these problems, we can use a photograph of the object and an appropriate scale factor. The idea is simple. If we had a blueprint of the object, we could easily use a ruler to measure the perpendicular distances from a set of points on the revolving line, to the axis of revolution. Then, using a scale factor, those blueprint measurements could be converted into the real object’s dimensions.
For this activity, a good side-view photo of the solid will serve as a blueprint. But instead of using a hardcopy of the blueprint and a ruler, we will insert the digital photograph in GeoGebra’s Graphics window and use GeoGebra’s tools to make the measurements on the photo. The other thing we need for this procedure is a known dimension of the solid, such as height or any easy-to-identify length, or something in the photograph with known dimensions, such as a ruler. With this known real-world dimension and its corresponding digital image measurement, we can determine the scale factor.
Volume Estimation Procedure: Make sure to practice this entire procedure before beginning the activity with students. The steps are also shown in an 18-minute video by the author as he estimates the volume of a power plant cooling tower; any other solid can be worked in the same way.
- Select a photograph of a solid of revolution you want to measure.
- If you do not have a picture of the solid, take a side-view photo of the object. Tip: Pay attention to the photograph you take. Do not take a photograph too close to the object; for small objects, a distance of 1 meter is recommended. Also, the perspective (angle) of your shot and the camera’s lens curvature may result in a distorted image of the solid’s shape. Aim to capture a focused shot without shadows in which the object looks as vertical or horizontal as possible. Consider including a ruler in the shot.
- Transfer the image file to a computer.
- In GeoGebra, insert the image file in the Graphics window using the Edit > Insert image from > file menu options.
- Position the picture such that the low-left vertex of it falls in the graphic window’s origin (x-y axis intersection). While doing this is not necessary, it ensures that all the values involved will be positive.
- As necessary, rotate the image until the solid looks as vertical or horizontal as possible.
- From the menu bar, use the Edit > Object Properties option. On the Basic tab in the Preferences window that opens, click the Fix Object box. Close this window.
- Be sure that the Algebra window is open. If it isn’t, click View > Algebra.
- Define a good axis of revolution for your solid by the following steps:
- Draw two segments perpendicular to the possible axis of revolution of your solid. Place these segments close to the base and top of the solid. This may seem a little bit odd because at this step you have to imagine the axis of revolution.
- From the Graphics toolbar, use the Mid-Point utility to find the mid-points of the two vertical segments.
- From the Line toolbar, use the Line utility to draw a line passing through the mid-points.
- From the Line toolbar, use the Polyline utility to draw the upper contour of your solid. Do not worry if at the beginning the points do not perfectly fall on the edge; later, they may be moved to the desired locations. Use a good number of points to construct the polyline, so that the line accurately fits the solid’s contour. Make sure to close the polyline by making the last point you click be the initial polyline point.
- From the Line toolbar, use the Segment utility to attach a segment to the axis of revolution and to the polyline. Be careful to click on the lines—not on the points—or you will not be able to change the segment’s position. This segment serves as your on-screen ruler.
- Move the on-screen ruler to the point on the axis of revolution that you consider the beginning of your solid’s revolving line. Be careful; the photograph may show a perspective effect (see Figure 7) due to the distance and angle it was taken, and because of this, a flat end like the solid’s base may appear curved on the picture.
- Measure the perpendicular distance from the solid’s axis of revolution to the polyline points, and the position of this distance on the axis of revolution. This distance will be the radius for that cross section.
Because it may be difficult to make the on-screen ruler really perpendicular to the axis of revolution, use an auxiliary perpendicular line. Set up and use this line in the following way:
- Using the Perpendicular Line tool, click first on the axis of revolution and then on the on-screen ruler’s end point on the polyline.
- Move this end point to the desired position, and then move the on-screen ruler’s end point laying on the axis of revolution, until the on-screen ruler overlaps with the movable perpendicular line.
- On the Algebra window, read the coordinate position of the on-screen ruler’s end laying on the axis of revolution, and also read the perpendicular distance in the segment’s length displayed in this same window.
- Record the above measurements on two different columns in the Spreadsheet window that you open with the View > Spreadsheet menu option.
- Take as many measurements as necessary to get an accurate estimate for the volume, moving the on-screen ruler along the axis of revolution. At the end of the process, you will have a table of values (x, y), where x is the position along the axis of revolution of the solid’s radius, and y is the length of this radius, but be careful; these values do not correspond to the real solid’s dimensions.
- Now that you have obtained the data, move to a more powerful spreadsheet application like Excel® to work with the data. To transfer the data, select the two columns on the GeoGebra spreadsheet, then copy and paste into an Excel® worksheet.
- Use a scale factor to change the above on-screen values into the solid’s dimensions. Obtain this scale by dividing the known real length of something in the picture, or of any part of the solid, by its corresponding length measured on-screen. Multiply every value (x, y) obtained in step 15 by this scale factor. Write the resulting values (xr, yr) in two new columns.
- Once the table with the solid’s real dimensions is ready, calculate the solid’s volume (or surface area as an activity extension). Steps for the volume computation:
- Take the yr values as R(xr), the length of the radius of the r-th cross section.
- Square all the radii R(xr) values. Record these R2(xr) values in a new column.
- Using the values (xr, R2(xr)), in a new column, compute the terms for the trapezoidal approach of the integral expression of the disc method:
 times the integral from a to b times R^2(x)dx is approximately equal to (pi/2) times the sum from i=1 to n of (R^2 (xi-1)+R^2(xi)) times (xi – xi-1)")
The number obtained from the above terms is an estimation of the volume value with an error of less than 5%. Many factors contribute to an increase or decrease in this error: a poor-resolution photograph, distortion due to the perspective from the object, lack of precision in placing the points on the objects contour, etc.
Steps for the surface area computation (activity extension):
- Compute the mid-points of the yr values: (yi + yi+1)/2 and record them in a new column.
- Compute the squares of the differences of the xr and yr values: (xi – xi-1)2, (yi – yi-1)2, and record them in new columns.
- Use these values to perform the following calculation:
 times y times the square root of 1 plus (dy/dx)^2)dx is approximately equal to 2*(pi) times the summation from i=1 to n of ((yi-1+yi)/2 times the square root of (xi-xi-1)^2 + (yi-yi-1)^2)")
Before the Activity
- Make copies of the Activity Pre-Quiz and Estimating Volumes Project Rubric, one each per student.
- Have ready for each student a personal computer with GeoGebra, Excel® and PowerPoint® installed.
- Transfer photographs of the marble sphere practice object (if no tangible spherical objects are available) and cooling towers (see Marble-Egg.zip and CoolingTowerImages.zip) to every computer.
- Feel free to use different pictures of the cooling towers that are assigned to groups (listed on the rubric and at the end of the Day 1 procedures; also see Figure 5) or cooling towers at different power plants, which can be found online. Also, if time permits, consider assigning students to conduct a short information search activity in which they find for themselves the photographs and dimensions.
- Tip: It is recommended that teachers watch the author’s 18-minute CoolingTower video to gain a clear understanding of the measurement procedure. Then become familiar with every step in this activity. Practice these steps with an everyday object like an egg. Refer to the answers in GeoGebraFiles-Answers.zip and ExcelFiles-Answers.zip.
With the Students: Day 1—Introduction and Begin Guided Practice
- Administer the pre-quiz to verify student competency in finding the volumes of solids of revolution using the disc method, and the trapezoidal rule for non-uniform partitions.
- Present to the class the Introduction/Motivation section content. At the end, ask students to brainstorm possible methods to determine the volume of an object using a photograph of it since it is very difficult if not impossible to measure these cooling towers directly.
- Guide the session to the point that the photograph can be used as a blueprint and the measurements performed on the image can be converted into the real object’s dimensions using an appropriate scale factor. Once the idea is clear, ask students how they might perform measurements on a photograph. One possible answer is to make a print of the photograph and use a ruler. The desirable answer is to use software to measure the object’s image displayed on a computer screen.
- Ask students: How can you measure the precision of the values obtained in this way? How can you quantify the error of your method? The desired answer is: Test the method with an object of known dimensions. Then estimate the method’s error or precision by comparing the real dimensions with the method results.
- Direct the class to organize into groups of three students. Hand out the project rubric.

With the Students: Days 2-4—Guided Practice with Spherical Objects
- Provide each group with a practice object—a spherical item like a tennis ball, baseball or big marble (see Figure 4). If no spherical object or no vernier caliper for measurements is available, have them use a photograph of a marble sphere (use the MarbleSphere.jpg digital file) with diameter = 5.64 cm, and volume = 93.9368 cm3. The volume estimated by the author was 95.1479 cm3 with a volume relative error of ~1.29%.
- Help students take photos of their practice objects and then transfer the image files to their computers. Conduct the guided practice of the volume estimation procedure outlined in the Background section. Be sure that students understand every step.
- Have students find the volumes of their practice objects. The equation to compute a sphere’s volume is well known. The volume of a spherical object is a function of the radius only:

- Once students find the volumes of their practice objects, have them compute the volume’s relative error. This error can be taken as the method’s error:
 / real volume")
With the Students: Days 5-7—Independent Practice with Assigned Cooling Towers
- Once students have determined the volume of their practice objects and understand the volume estimation procedure, they are ready to estimate the volume of a bigger and more complex object—one they cannot hold in their hands. So, randomly assign each team one of the power plant cooling towers listed below (some of which are shown in Figure 5) with the task to estimate the volume of the tower:
- Doel Power Station, Belgium (height: 176 m)
- Westfalen Power Plant, Germany (height: 122 m)
- West Burton Power Stations, UK (height: 107 m)
- Kharkov Power Plant, Ukraine (height: 90 m)
- Drax Power Station, UK (height: 114 m)
- Ratcliffe-on-Soar Power Station , UK (height: 118 m)
- Fiddlers Ferry Power Station, UK (height: 114 m)
- Homer City Generating Station, US (height: 110 m)
- Willington Power Station, UK (height: 91 m)
- Blackburn Meadows Power Station, UK (height: 76 m)
- ABLE Thorpe Marsh Power Station, UK (height: 100 m)
- Chapelcross Power Station, Scotland, UK (height: 91.5 m)
- Dukovany Power Station, Czech Republic (height: 125 m)
 Top row: Drax Power Station, England; Westfalen Power Plant, Germany; Doel Power Station, Belgium. Middle row: Chapelcross Power Station, Scotland; Homer City Generating Station, PA, USA; Kharkov Power Station #5, Ukraine. Bottom row: Dukovany Power Station, Czech Republic, and ABLE Thorpe Marsh Power Station, England.")
With the Students: Suggested Activity Workflow
Day 1: Introduction and Begin Guided Practice (50 minutes)
- Administer the pre-quiz.
- Present the Introduction/Motivation content to the class, including two online animation videos.
- Brainstorm possible solutions.
- State method.
Day 2: Guided Practice (50 minutes)
- Select/distribute the object to measure during guided practice.
- Take photos of the object and transfer them to computers. Select the best one.
- Measure the practice object’s diameter.
- Insert image in GeoGebra window.
- Draw axis of revolution.
Day 3: Continue Guided Practice (50 minutes)
- Draw polyline and match the solid contour.
- Insert on-screen ruler and perpendicular auxiliary line.
- Begin radii measurements and record these values on spreadsheet.
- Continue radii measurements.
- Compute the scale factor.
Day 4: Finish Guided Practice (50 minutes)
- Copy and paste values in GeoGebra spreadsheet into an Excel® worksheet.
- Use the scale factor to convert on-screen measured values into real solid dimensions.
- Use the trapezoidal rule to compute volume.
- Compute the relative error.
Day 5: Begin Independent Practice (50 minutes)
- Randomly distribute cooling towers pictures to teams.
- Students begin estimation of cooling tower volume.
Day 6: Continue Independent Practice (50 minutes)
- Students continue with the estimation of cooling tower volume.
Day 7: Finish Independent Practice (50 minutes)
- Students conclude with the estimation of cooling tower volume.
- Teams begin to prepare results report in PowerPoint® (or video format).
Day 8: Results Report Preparation and Presentation (50 minutes)
- Teams prepare standalone slideshows (or videos).
- Final results presentations given to class.
- Teacher uses rubric for grading.
Vocabulary/Definitions
blueprint: A reproduction of a technical drawing that documents an architectural or engineering design. Something that acts as a plan, model or template.
disc method: A way to calculate the volume of a solid of revolution by taking the sum of cross-sectional areas of infinitesimal thickness of the solid. The volume, V, of a solid of revolution is calculated by integrating the function modeling the solid’s revolving line along the axis of revolution, and then multiplying times pi (ℼ). Also known as the method of rings or disc integration.
finial: An element that marks the top or end of some object. In architecture, often a decorative device of stone, metal or wood that emphasizes the apex of a dome, spire, tower, roof or gable at the top, end or corner of a building or structure.
integral calculus: A branch of mathematics that deals with integrals, especially the methods of ascertaining indefinite integrals and applying them to the solution of differential equations and the determining of areas, volumes and lengths.
numerical integration: The approximate computation of an integral using numerical techniques.
oval: A closed curve in a plane that resembles the outline of an egg. Can be constructed geometrically by joining two ellipses at their minor axes. An oval has three different axes: one equatorial axis (A), and two polar axes (B and C). The equation to compute the volume of an oval is V = 2*(ℼ/3)*A^2 (B+C)
scale factor: A number used as a multiplier in scaling. To find the scale factor of two similar figures, locate two corresponding sides, one on each figure. Write the ratio of one length to the other to find the scale factor from one figure to the other.
similar figures: Objects that are the exact same shape but different sizes. Two figures are similar if the lengths of their corresponding sides form a proportion.
solid of known cross section: A solid generated by moving along a straight line or axis, a regular shape perpendicular to this axis, whose area may vary with its position along the axis. The usual shapes are regular polygons. Solids of revolution are special cases of solids of known cross section, when the shape is a circumference.
solid of revolution: A solid figure obtained by rotating a plane curve 360 degrees around a straight line (the axis) that lies on the same plane. The curve sweeps out a surface, and the region inside the surface defines a solid.
trapezoidal rule: A technique to estimate a definite integral, approaching the region under the graph of the function f (x) as a trapezoid, or a collection of trapezoids, and calculating the area.
vernier caliper: A measuring instrument consisting of an L-shaped frame with a linear scale along its longer arm and an L-shaped sliding attachment with a vernier scale, used to read the dimension of an object represented by the separation between the inner or outer edges of the two shorter arms. The measurement precision is one-tenth of a millimeter.
volume of a solid of known cross section: Calculate the volume of a solid of known cross section A(x), when this section is perpendicular to the x-axis, by integrating this functional expression along the x-axis.
Assessment
Pre-Activity Assessment
Pre-Quiz: Administer the Activity Pre-Quiz. Verify that all students know how to find volumes of solids of revolution using the disc method, and the trapezoidal rule for non-uniform partitions.
Activity Embedded Assessment
Practice: During guided and independent practice, verify that students understand and can correctly perform all steps of the volume estimation procedure. If students used the provided photographs of the marble egg and marble sphere for their practice objects, check their answers by referring to the Excel® and GeoGebra answer files in Marble-Egg.zip. To check student answers generated for the cooling towers; refer to the GeoGebraFiles-Answers.zip and ExcelFiles-Answers.zip for the cooling tower measurements and volume calculations.
Post-Activity Assessment
Results Presentation: Have teams each create a final report in PowerPoint® as a standalone slideshow (or a video), explaining the project background and motivation, procedure to indirectly measure a cooling tower, procedure to estimate volume, and results obtained, as detailed in the Estimating Volumes Project Rubric. As students make presentations to the rest of the class, use the rubric for grading and refer to the Cooling Towers Estimated Volumes Key for answers.
Troubleshooting Tips
A natural question is: What is the precision of the proposed method to estimate the volume of the cooling towers? Unfortunately the information about the towers included in this activity is very limited; not enough information is available to calculate the real volume, and compare it with the estimated volume.
This the shape of this type of cooling tower is a hyperboloid generated by revolving two hyperbolas joined at their vertices. The computation of the volume of the cooling towers is not a difficult task. Having the three main diameters of the tower: base, throat (narrowest section) and cornice (top), and their corresponding elevations, it is possible to find the equations of the hyperbolas that generate the hyperboloid. Then the volume can be found by using the disc method.
An exercise done by the author, with some information and images found on the Internet (but that are not included here because permission was not granted by the owners) resulted in some important guidelines.
 and distance. Drawing (a) shows the tower as seen from its vertical mid-point at some distance away; it has crisp corners and looks wide at the bottom and straighter at the top. Drawing (b) is from a higher angle so that part of the top inside lip can be seen, and the tower top and bottom look equally flared. Drawing (c) from a closer distance looks like it flares at only the bottom like (a), but has different dimensions as well as rounded and distorted corners all around.")
To obtain the best results, use a good side photograph of the tower (Figure 6a). In this case, the deviation of the estimated value from the real value ranges from 1% to 4%. As the elevation from which the photograph was taken increases (Figure 6b), the deviation becomes greater than 5% and could be more than 20% as is shown in the 6b case. The proximity effect (Figure 6c) also increases the estimation error, and the deviation could be more than 15%, like in the 6c case. Tip: For objects for which you want to estimate their volumes, use images of the objects that look most like blueprints (6a)
If you are interested in the details of the just-described exercise, you are welcome to contact the author, Miguel R. Ramirez, at mramirez2@galenaparkisd.com or 832-386-2922, to request the files used and results.
Activity Extensions
Extend the activity by having students also calculate the surface areas of their solid objects (refer to the steps and equations in the Background and Activity Scaling sections.)
If you have vernier calipers and want to give students an extra challenge , ask them to bring an egg from home, take a good side-view photograph of the egg, measure its height and major diameter, and then compute its volume using the following equation:
")
Where A is the equatorial diameter (diameter of the largest circular cross section), and B + C is the egg’s height. Refer to files in Marble-Egg.zip for the calculations to estimate the volume of a marble egg.
Activity Scaling
 changes, resulting in a stack of variously sized truncated cones. The total volume of this solid can be approximated by adding together the volumes of the truncated cones that compose it. Superimposed over the photo is a line drawing of a truncated cone (a cone with its nose/point cut off) with dashed lines indicating its height, length, top radius, r, and bottom radius, R, followed by a volume equation: V = 1/3*pi*h (R^2 + r^2 + Rr).")
For lower grades: For students with no calculus background, adjust the activity to have them approximate the volume of a solid of revolution using volumes of truncated cones (see Figure 7). To do this, have them complete the same steps 1 to 17 of the volume estimation procedure until they get a table of values (xr, R(xr)): distances of a set of points on the revolving line to the axis of revolution.
Then have them work these pairs of values like they were for the trapezoidal rule, but instead use the formula corresponding to the volume of a truncated cone:
*h (R^2 + r^2 + Rr)")
that for the values (xr, R(xr)) will be:
/3*(xi-xi-1)*(R^2 (xi) + R^2 (xi-1) + R^2 (xi) * R^2 (xi-1))")
For higher grades: Have students compute the surface area of a solid of revolution (an AP Calculus BC topic) from the same values used to compute the volume, but now using the formula:
^2)dx")
![S = ~ 2*(pi) times the summation from i=1 to n of [((yi-1+yi)/2) times the square root of ((xi-xi-1)^2+(yi-yi-1)^2)].](/content/ind_/activities/ind_complex_solids_activity1_equation11.png "S = ~ 2*(pi) times the summation from i=1 to n of [((yi-1+yi)/2) times the square root of ((xi-xi-1)^2+(yi-yi-1)^2)].")
Students can test this approach by computing the surface area of a spherical object and then comparing with the value obtained using the sphere’s surface area formula: S = 4*pi*r2. For the 5.64 cm diameter marble sphere, the estimated surface area is: 100.785 cm2. The real area is: 99.933 cm2. Thus, the area relative error is ~0.85%.
Additional Multimedia Support
For teachers: To prepare for the activity, watch the 18:44-minute Cooling Tower video by the author at https://www.youtube.com/watch?v=qNy9-Ld_N7U
During the Introduction/Motivation section, show students the following video animations:
- How Nuclear Power Plants Work / Nuclear Energy by Thomas Schwenke (4:47-minutes) at https://www.youtube.com/watch?v=_UwexvaCMWA
- Cooling Tower / Stack Effect / Natural Convection by Thomas Schwenke (2:16-minutes) at https://www.youtube.com/watch?v=xKzenFW0ZIg
A comprehensive list of additional resources about calculus, GeoGebra, Excel®, PowerPoint®, nuclear power plants, cooling tower information and photos, engineering achievements (websites, videos, books) is provided in the Estimating Volumes Project Rubric.
Subscribe
Get the inside scoop on all things TeachEngineering such as new site features, curriculum updates, video releases, and more by signing up for our newsletter!More Curriculum Like This

High school students learn how engineers mathematically design roller coaster paths using the approach that a curved path can be approximated by a sequence of many short inclines. They apply basic calculus and the work-energy theorem for non-conservative forces to quantify the friction along a curve...

Learn the basics of the analysis of forces engineers perform at the truss joints to calculate the strength of a truss bridge known as the “method of joints.” Find the tensions and compressions to solve systems of linear equations where the size depends on the number of elements and nodes in the trus...
Students learn about nondestructive testing, the use of the finite element method (systems of equations) and real-world impacts, and then conduct mini-activities to apply Maxwell’s equations, generate currents, create magnetic fields and solve a system of equations. They see the value of NDE and FEM...
References
Briggs, William L., Cochran, Lyle, and Gillett, Bernard. Calculus AP Edition. Upper Saddle River, NJ: Pearson Education, 2014.
Cooling Tower. Wikipedia, The Free Encyclopedia. https://en.wikipedia.org/wiki/Cooling_tower
Gould, Phillip L. and Krätzig, Wilfried B. Cooling Tower Structures. Chapter 14, Structural Engineering Handbook. Ed. Chen Wai-Fah. Boca Raton, FL: CRC Press LLC, 1999. http://freeit.free.fr/Structure%20Engineering%20HandBook/14.pdf
Greatest Engineering Achievements of the 20th Century. National Academy of Engineering. http://www.greatachievements.org/
Kraetzig, Wilfried B., Harte, Reinhard, Montag, Ulrich, and Woermann, Ralf. “From Large Natural Draft Cooling Tower Shells to Chimneys of Solar Upwind Power Plants.” Proceedings, International Association for Shell and Spatial Structures (IASS) Symposium, 2009, Valencia, Spain. https://riunet.upv.es/bitstream/handle/10251/6462/PAP_KRAETZIG_02.pdf
Larson, Ron, Edwards, Bruce, and Hostetler, Robert P. Calculus of a Single Variable, 8th Edition. Boston, MA: Houghton-Mifflin, 2006.
Other Related Information
You are welcome to contact the author, Miguel R. Ramirez at mramirez2@galenaparkisd.com or 832-386-2922 to ask any questions related to this activity.
Copyright
© 2016 by Regents of the University of Colorado; original © 2013 Miguel R. RamirezContributors
Miguel R. Ramirez, Galena Park High SchoolSupporting Program
Miguel R. Ramirez, high school math teacher, Texas, USAAcknowledgements
The author expresses his thanks to Tony Gardea, Galena Park High School Principal; Seretha Augustine, Galena Park High School Associate Principal for Curriculum; and Gerard Kwaitkowski, Galena Park High School Math Specialist.
Last modified: July 20, 2023
User Comments & Tips